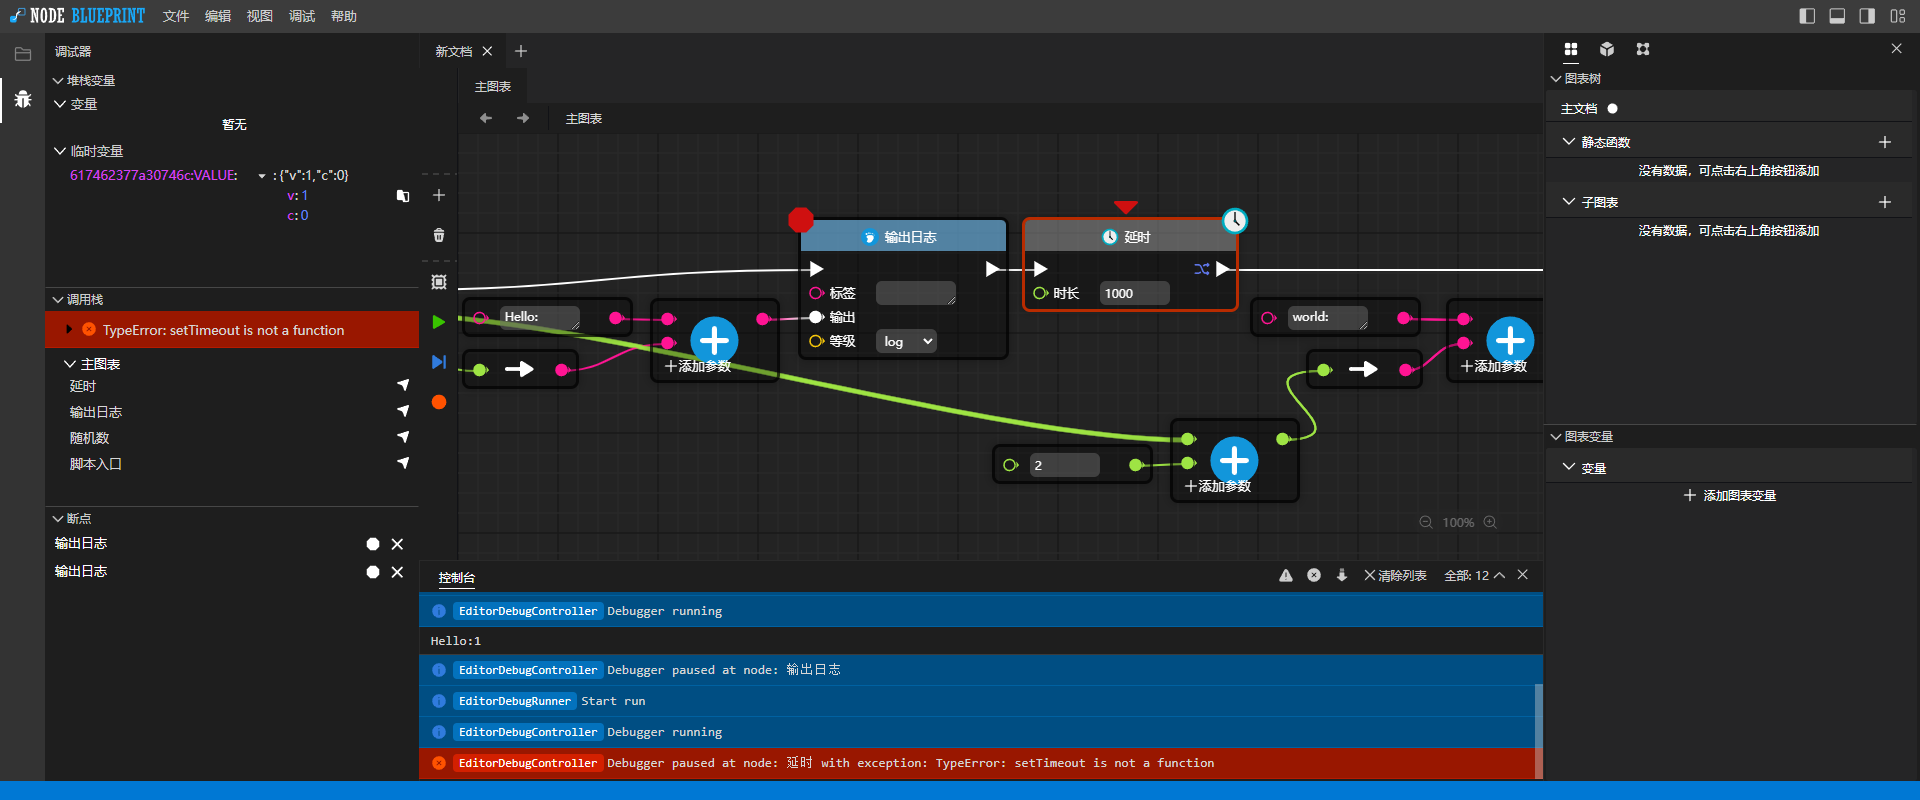
A visual script editing and running program based on JS like unreal engine blueprint
- Easy drag unit and cable that you can programming
- Based on JavaScript, it can be applied to web platform, and the development is simple
- Support electron, can be applied to desktop platform
- Support debugging, single step execution, variable view
- Customizable code block, quickly embed your code
This is a visual scripting app that similar to the Blueprint of Unreal Engine, but based on HTML and JS, you can encapsulate some complex and functional codes into functional units that can be repeatedly called, then organize and call them with simple and easy to understand flow script. You can use blueprints to control the operation of the program. Users can not understand programming, and can also control the program with high definition and fine control.
In some application scenarios, the user needs to have a high degree of customization for the program, such as controlling the data acquisition and processing operation; or the device control needs to be able to customize the action, but the user does not understand the programming situation. You can encapsulate your own devices or business codes into callable units, handle parameters, events, etc., and write documents, so that users can customize calls and data processing based on simple flow charts. Users only need to drag and drop the connection on the flow chart to customize the operation process they want.
There is currently no release. However, you can try debugging the version first.
- Install:
npm install
At present, it supports two platforms, electron and web:
- Web:
npm run dev
# After compiling, visit localhost:5173
⚠ This project has not been fully developed and mature, do not use in any production project! ⚠
At present, only the author is developing... If you are also interested in this, you can also help me develop it together, Thank you very much for your support!
- Run it.
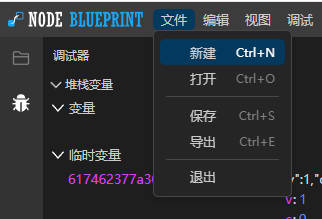
- After opening, click "New flowchart" on the home page or click "File > New File" on the menu.
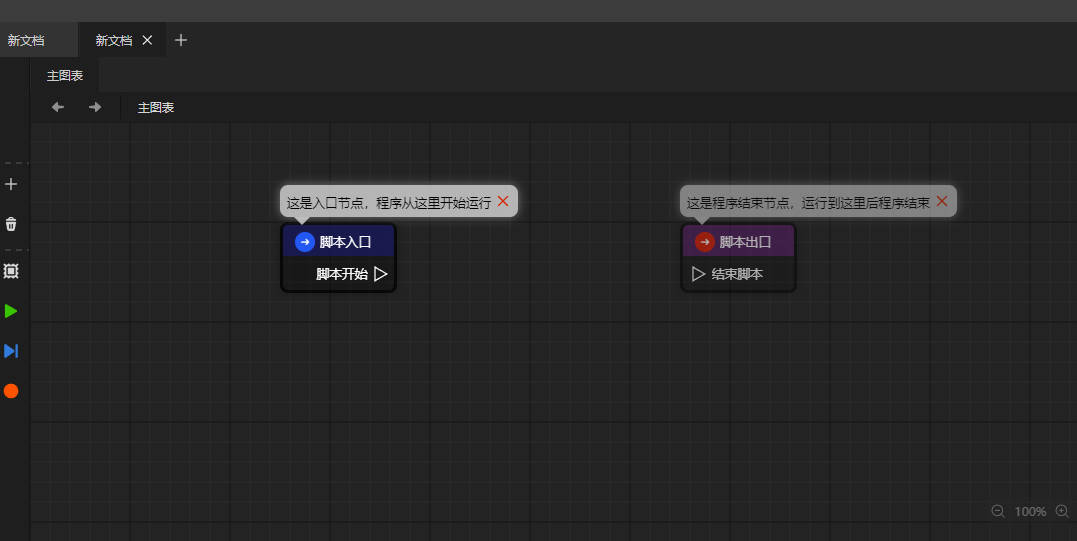
- The default document has two units, one is the entry and the other is the exit. Right click and hold in the chart to move the view.
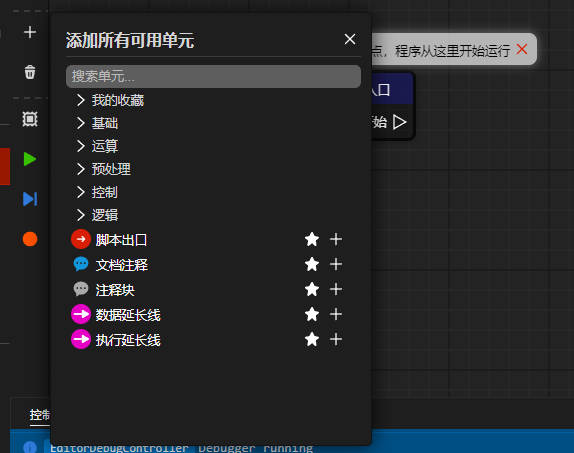
- Click the "+" button on the left toolbar or right-click in the chart to pop up the add cell menu. Select what you want to add in it. You can click once to add it to the mouse position. Press and drag to add it to the user-defined position.
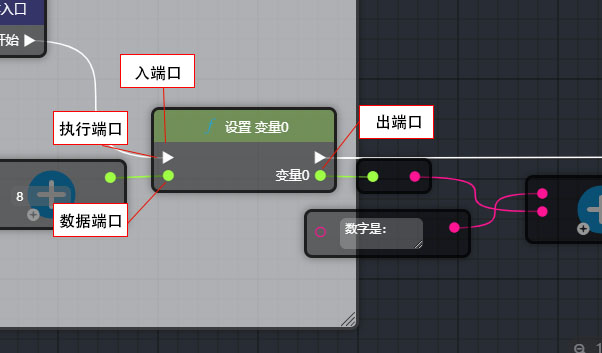
- Each unit has its own port, the left is the entrance, the right is the exit. The triangle is the execution port, and the program is based on it; the circle is the data port, and the data flows according to it.
- Click the green triangle on the toolbar to debug (currently there is no debug output, but you can use the browser's own debug tool to view the output and debug information).
Click the blue arrow on the toolbar to indicate single step debugging. Each step will pause. The chart will show the direction of the program. You can move the mouse over the port to display the current data value of the port.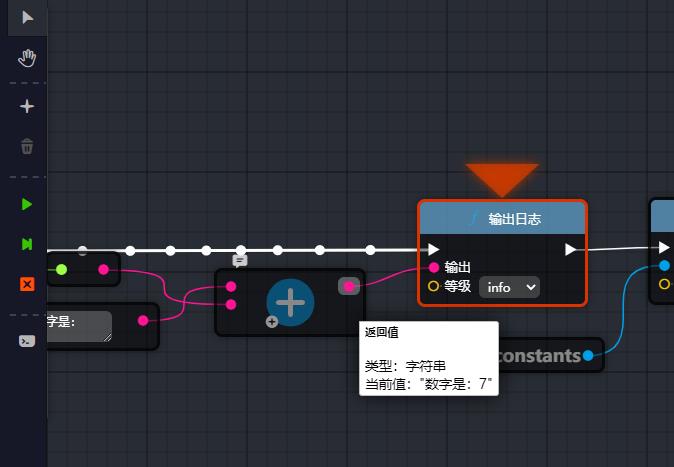
- These are the only features available now.
MIT license is used in this project.

