Black color bug in Heatmap #12420
Labels
bug
Fixes for quality problems that affect the customer experience
Feature:Heatmap
Heatmap visualization
Feature:Visualizations
Generic visualization features (in case no more specific feature label is available)
Hello, I am having a bug regarding colors on a heatmap. More details below.
Kibana version: 5.4.0
Elasticsearch version: 5.4.0
Server OS version: elementary OS 0.4 Loki (64 bit)
Browser version: Mozilla Firefox 50.1.0
Browser OS version: same as server
Original install method (e.g. download page, yum, from source, etc.): Download page.
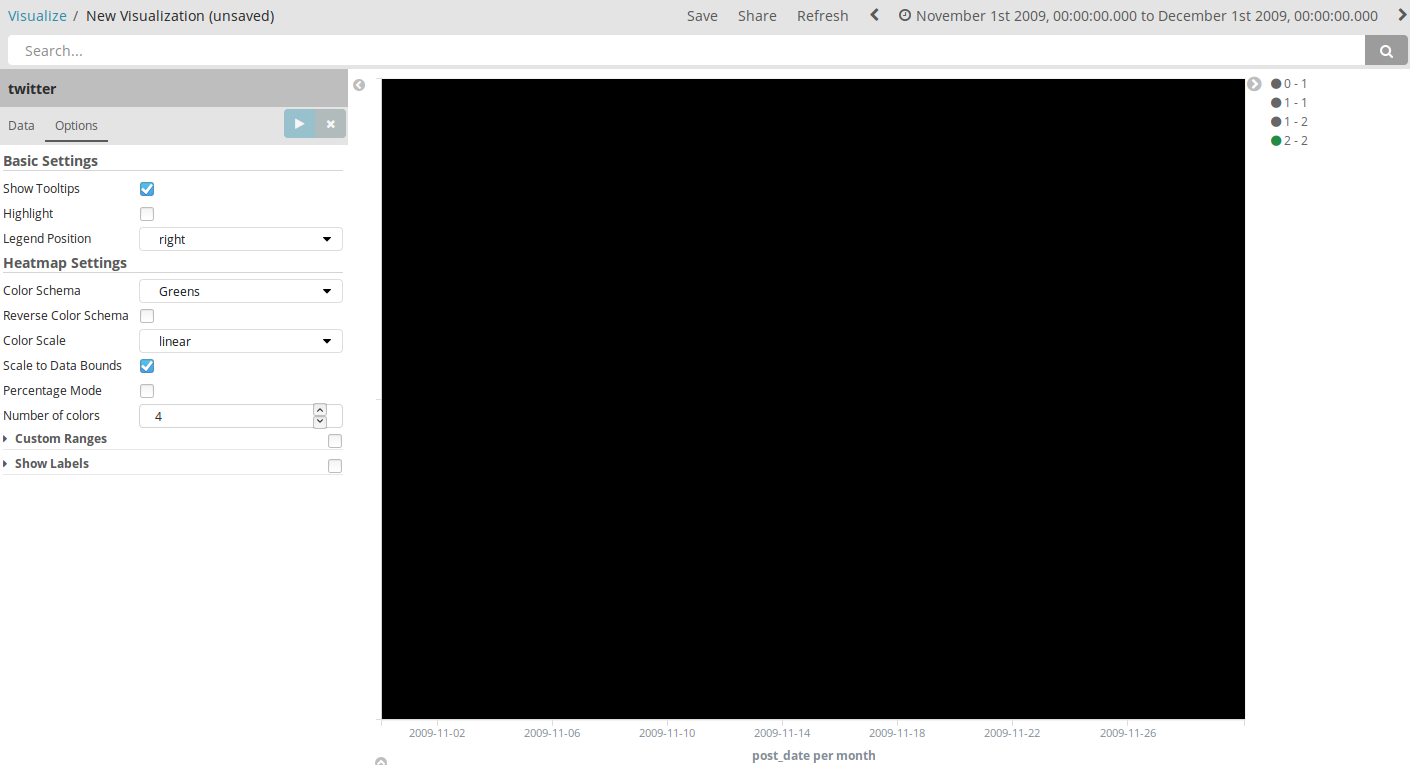
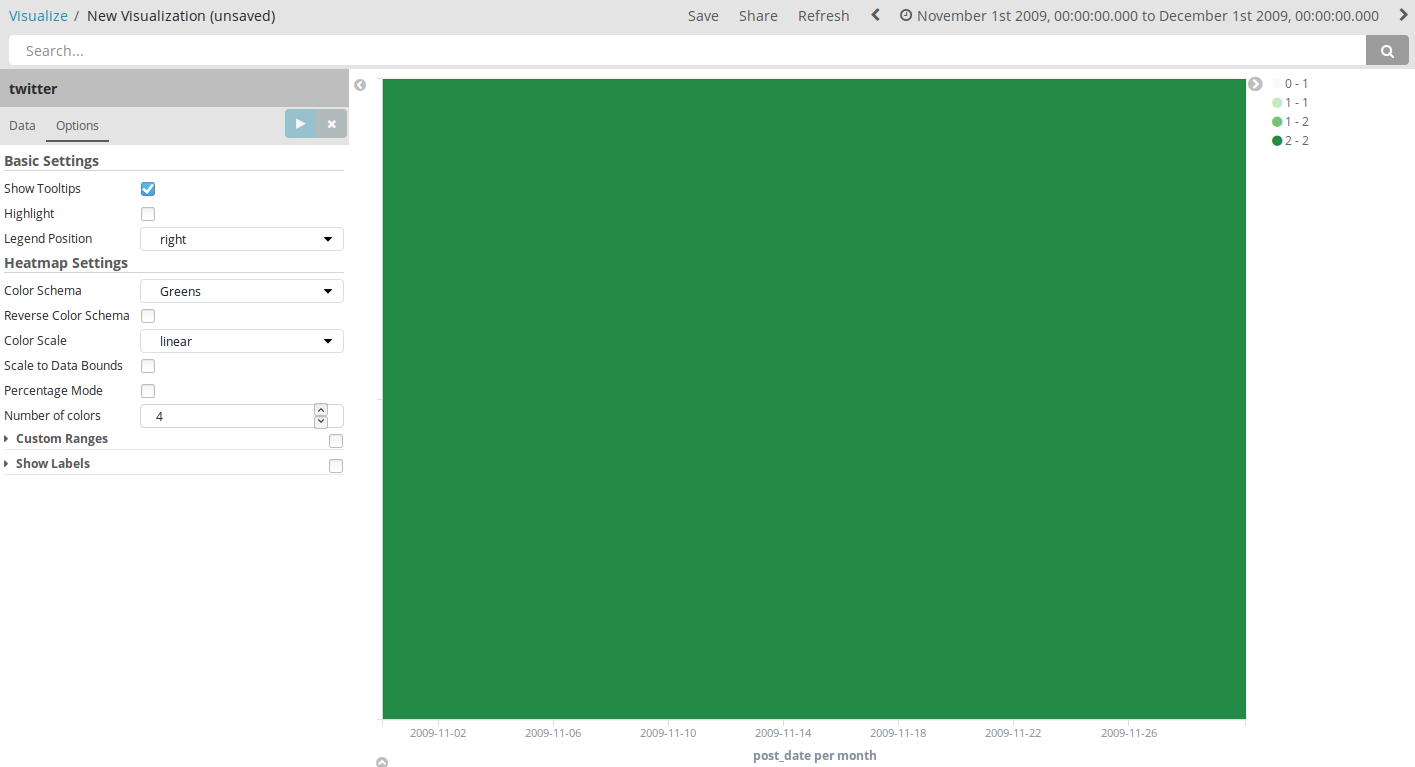
Description of the problem including expected versus actual behavior: When checking 'scale to data bounds' field, the heatmap graph becomes entirely black (I expected it to be one of the heatmap colors). If I uncheck this option, the color becomes one of the colors specified on the heatmap (which was expected).
Steps to reproduce:
`curl -XPUT 'http://localhost:9200/twitter/user/kimchy?pretty' -H 'Content-Type: application/json' -d '{ "name" : "Shay Banon" }'
curl -XPUT 'http://localhost:9200/twitter/tweet/1?pretty' -H 'Content-Type: application/json' -d '
{
"user": "kimchy",
"post_date": "2009-11-15T13:12:00",
"message": "Trying out Elasticsearch, so far so good?"
}'
curl -XPUT 'http://localhost:9200/twitter/tweet/2?pretty' -H 'Content-Type: application/json' -d '
{
"user": "kimchy",
"post_date": "2009-11-15T14:12:12",
"message": "Another tweet, will it be indexed?"
}'`
On kibana, create an index for this example, and then go to: visualize -> create new visualization -> heatmap -> "twitter"
Change the time range to search for november/2009. Select the bucket "x-axis", with the aggregation "date histogram" with the interval "monthly". Under options, check "scale to data bounds". When running the new configurations, the graph should become black.
Here is a screenshot of the black graph with the "scale to data bounds" option (it should not be black):

And here is the graph when I uncheck the "scale the data bounds" option:

Thank you for your support.
The text was updated successfully, but these errors were encountered: