We check query performance by using the explain command.
explain select * from users;This will return an execution plan which is generated by Postgres. For the command above, the execution plan will show how the table reference by statement will be scanned.
The most important thing to note is the cost.
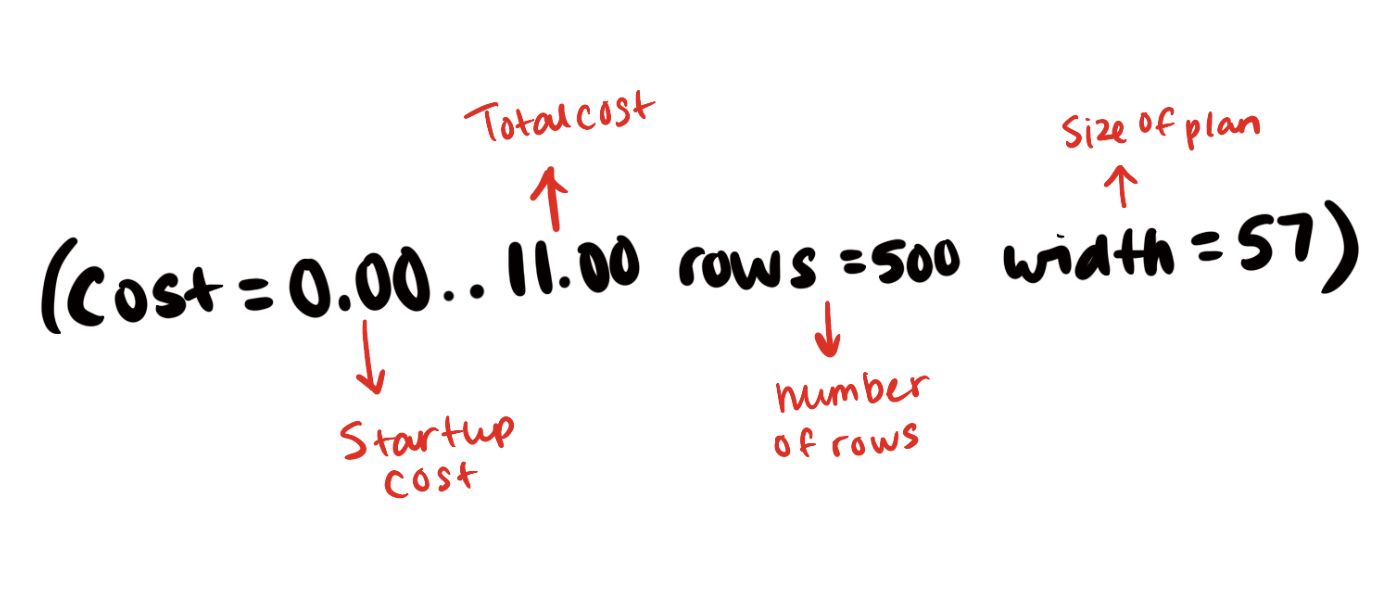
The cost output shows two different values that are seperated by 2 dots --> startup cost..total cost
Startup cost: The time it takes for the first row to be returned. Total cost: The time it will take for all of the rows from our query to be returned.
Here's a little visual to make this easier to visualize :)
We can view the same output in different formats like JSON, YAML, XML etc. We do this by typing the following:
explain (format json) select form Users;If you want to see this in another format, just replace json with your desired format.
We can get even more output and information from explain by using the verbose option.
Using verbose will show us what schema the table exist on and the columns in the table.
One of the most important things to remember about explain is that when we call it, we don't actually run our query. It acts more like a simulator. Really, the planner just shows estimates aka guesses.
So running explain update users set email = null doesn't actually update the users table.
If we want the actually want 100% accurate output, run explain with analyze.
explain analyze update users set email = null;Just remember, running explain analyze will actually run your query.
When we run explain select * from users;, the select initiates a sequential scan. So the select statment loops over every single row until the end of the table.
The index scan is faster. Running this kind of command:
explain select * from users where user_handle = `a0eebc99-9c0b-4ef8-bb6d-6bb9bd380a11`;Although index scan can be faster, it's startup cost can be longer than sequential scan in some cases.
In the example above, the where option was used. It's important to remember for options like where and join will end up affecting the cost.
It can be hard to determine which options will have the most optimal results with cost. But each table is different. To find the best, most optimal options, you'll have to run them through a profiler.
