You signed in with another tab or window. Reload to refresh your session.You signed out in another tab or window. Reload to refresh your session.You switched accounts on another tab or window. Reload to refresh your session.Dismiss alert
Hi,亲爱的 TuGraph 团队与用户:
Hi, Dear TuGraph team and users:
首先,非常感谢 TuGraph 团队为社区贡献了如此美好的产品!
First of all, we are so appreciate that TuGraph Team has created such a good product to the community!
我们是蚂蚁集团 AntV 图可视化小组。我们在去年开源了一款基于 AntV G6 (G6 官网)的图可视化与分析平台 G6VP。用户可以在这个平台上连接自己的数据,包括本地文件上传,或多种图数据库。然后在这个平台上使用我们提供的丰富的图可视化与分析资产,进行数据的分析。并且,G6VP 支持用户自由地、交互式地组装不同的数据源、图可视化与分析资产以设计和产出自己的图可视分析产品,甚至嵌入到自己的系统当中。
We are members of AntV Graph Visualization team of Ant Group. We have opened source a graph vis platform based on AntV G6 (G6's website)named G6VP, where users could connect to their own datasource with uploaded files or several graph databases, and then analyze the graph data with powerful graph visualization and analysis assets provided by G6VP. What's more, users could interactively integrate the analysis assets / components provided by G6VP to create their own graph applications and output SDK or HTML for embedding into their systems.
现在,G6VP 支持了 TuGraph 作为一个重要的数据源!非常感谢 TuGraph 团队的答疑和支持!
Now, we have supported TuGraph as one important datasource on G6VP! Thanks for the supports from TuGraph team!
下面是在 G6VP 上使用 TuGraph 作为数据源的步骤:
Here goes the steps to connect TuGraph on G6VP:
Step 1: 启动 G6VP 代理服务 / Start The Proxy Service of G6VP
我们假设您已经完成了 TuGraph 数据库服务的启动和数据导入工作。
In this step, we suppose that you have already accomplished the TuGraph Service starting and data importing.
由于目前 TuGraph 本地服务暂时无法通过网页直接跨域请求,因此我们需要启动本地的 G6VP 及其 http server,通过 G6VP 的 BFF 层进行请求。
Since the local TuGraph service does not support cross-origin requests through web pages, so you have to start G6VP http server, and then the requests will be transmitted by G6VP's BFF server.
解压 gi-httpservice.tgz,进入文件启动服务,在此之前请先确保本机电脑有 NodeJS 环境
Unzip gi-httpservice.tgz and enter the file to start the service. Before doing that, make sure the NodeJS environment is available on your computer
cd gi-httpservice

lsof -i:7001  // make sure port 7001 is available

npm run start
方案二:克隆 G6VP 源码启动 / Clone G6VP Source Code
克隆 G6VP 代码:
Clone the code of G6VP from GitHub by the running command in your terminal:
终端进入 G6VP/packages/gi-httpservice 文件夹
Enter the folder 'G6VP/packages/gi-httpservice' in your terminal:
cd {The path where the cloned G6VP source code at}/G6VP/packages/gi-httpservice
安装依赖
Install the dependencies:
npm install
启动 httpservice
Start the service:
npm run dev
此时,G6VP HTTP 服务启动完成,访问 http://127.0.0.1:7001 ,(默认端口 7001),可以在控制台看到下面提示:
Now, G6VP http service is running, visit http://127.0.0.1:7001, (7001 is the default port), you will see the tips in the console of browser
Proxy Address: It is the G6VP http service address started at step 1, the default port is 7001. If you start it at local, the address will be: http://127.0.0.1:7001
Engine Address: It is the TuGraph service address
点击「开始连接」,若成功连接,右上方将出现下图提示,下方将出现「选择子图」 panel,「选择子图」的下拉框中列举了该 TuGraph 服务中的所有子图名称,选择其中一个子图,例如「default」
Click 「开始连接」(Connect) button and you will see the tip if it is success, and the subgraph select panel will be shown at below,Select a subgraph from 「Select Subgraph」. such as 「default」
Step3:创建数据集 / Create a dataset base on tugraph
再给选择的子图命名「movie」,然后点击「进入分析」,即可创建数据集成功,页面将跳转到「数据集」模块,您将在数据集列表中看到刚刚创建的名为“movie” G6VP 数据集:
give the subgraph a dataset name「movie」,and Click 「Enter Analysis」, the page will jump to the list of the datasets, and you will find the dataset you just created:
Step4: 创建分析画布 / Create an analysis workbook
点击对应数据集右侧的蓝色的电脑 icon,即使用该数据集创建工作簿,此时,页面跳转到新建工作簿页面,数据集和模版已为您填充好,在「工作簿名称」输入框为该该工作簿起一个名称,然后点击「创建画布」,即可进入工作簿。
Click the blue computer icon on the right of the dataset record in the list to create a workbook with the dataset. You will see the page below and the dataset field is already filled and please name the workbook and then click 「create an analysis canvas」
点击「创建画布」后,您将看到一个空白的画布,以及左侧的配置面板:
After that, a workbook is successfully created and you will see an empty canvas with configuration panel like this:
Step5:开始分析 / Analyze the Data
此时,您已经完成了 HugeGraph 数据库的连接和数据、工作簿的创建,可以在刚刚新建的工作簿中进行数据分析了。默认的「极简模版」中已经内置了 TuGraph 查询需要的「Cypher 语句查询」组件。例如下图中的 MATCH (n) RETURN n limit 10 可以成功查询到十个节点:
Now, you have completed the database connecting and workbook creating. Here goes the Graph Visualization and Analysis! The Cypher statement query component required for TuGraph queries is already built into the default "minimalist" template. For example, MATCH (n) RETURN n limit 10 can successfully query ten nodes:
如果目前节点和边的样式不符合您的要求,可以在「样式」中进行配置:
If you are not satisfy with the nodes and edges' styles, configuring it on the style panel on the left:
单击一个节点,可查询其详情,并显示在属性面板中:
Click one node to see the property panel:
选择一个或多个节点,在节点的右键菜单中,选择「一度扩展」,进行该节点的邻居查询:
Select one or brush multiple nodes and right click to expand the neighbors:
扩展结果:
The result after expanding:
如果这个邻居扩散资产不符合需求,可以在左侧面板进行配置:
Configure the neighbor querying asset on the left if it does not meet the requirement:
使用过滤取来分析统计数据,我们提供了过滤器的智能推荐:
Use the filter to analyze the statistical info, and there will be an intelligent recommend:
上面仅仅介绍了最为基础的功能。还有大量超酷的图分析资产可以在资产中心找到,你可以集成这些资产到不同的容器中,来设计和建设您的图应用:
The introduction above is only about the basic functions. Plenty of fancy graph analysis assets will be found at the assets center,you can Integrate them into different containers to build up your own applications:
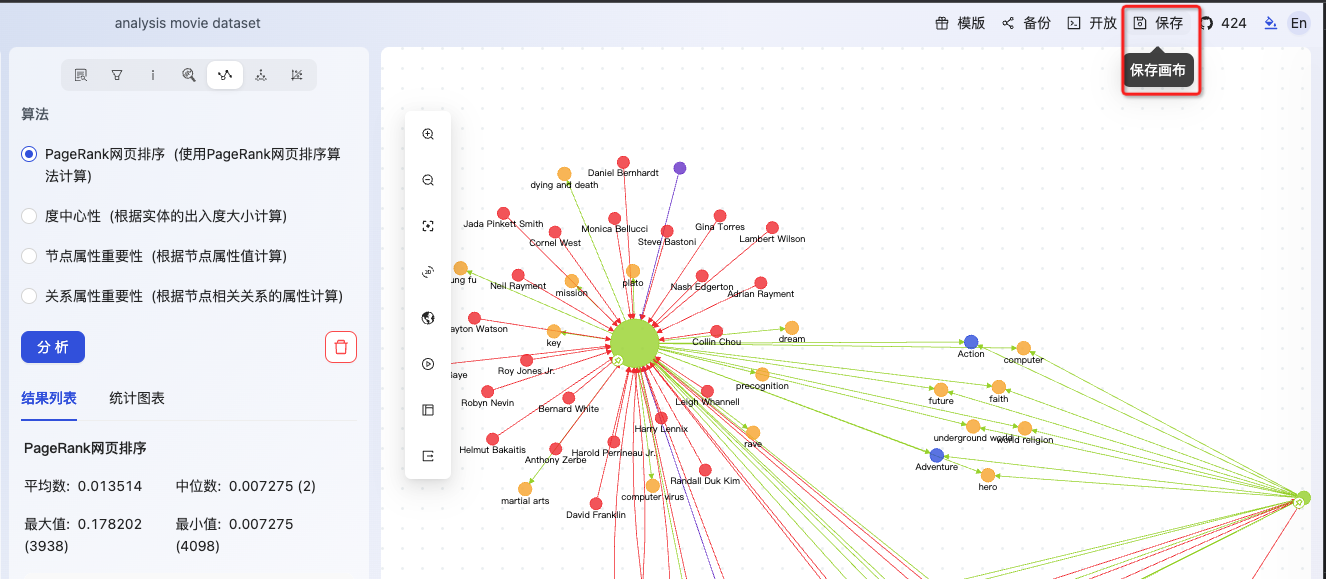
最后,别忘了保存刚刚配置完成的工作簿:
Last but not least, do not forget to save your workbook after the above operations:
次进入 G6VP,就可以在工作簿列表中找到这个工作簿了。别担心,所有的数据信息、工作簿配置信息都存储在您的电脑本地缓存,G6VP 不会获取任何用户数据信息:
Next time you visit G6VP, you will found your workbook at the workbook list. Don't be worry, the datasets info, workbooks are all cached at your computer. G6VP will not record any user information!
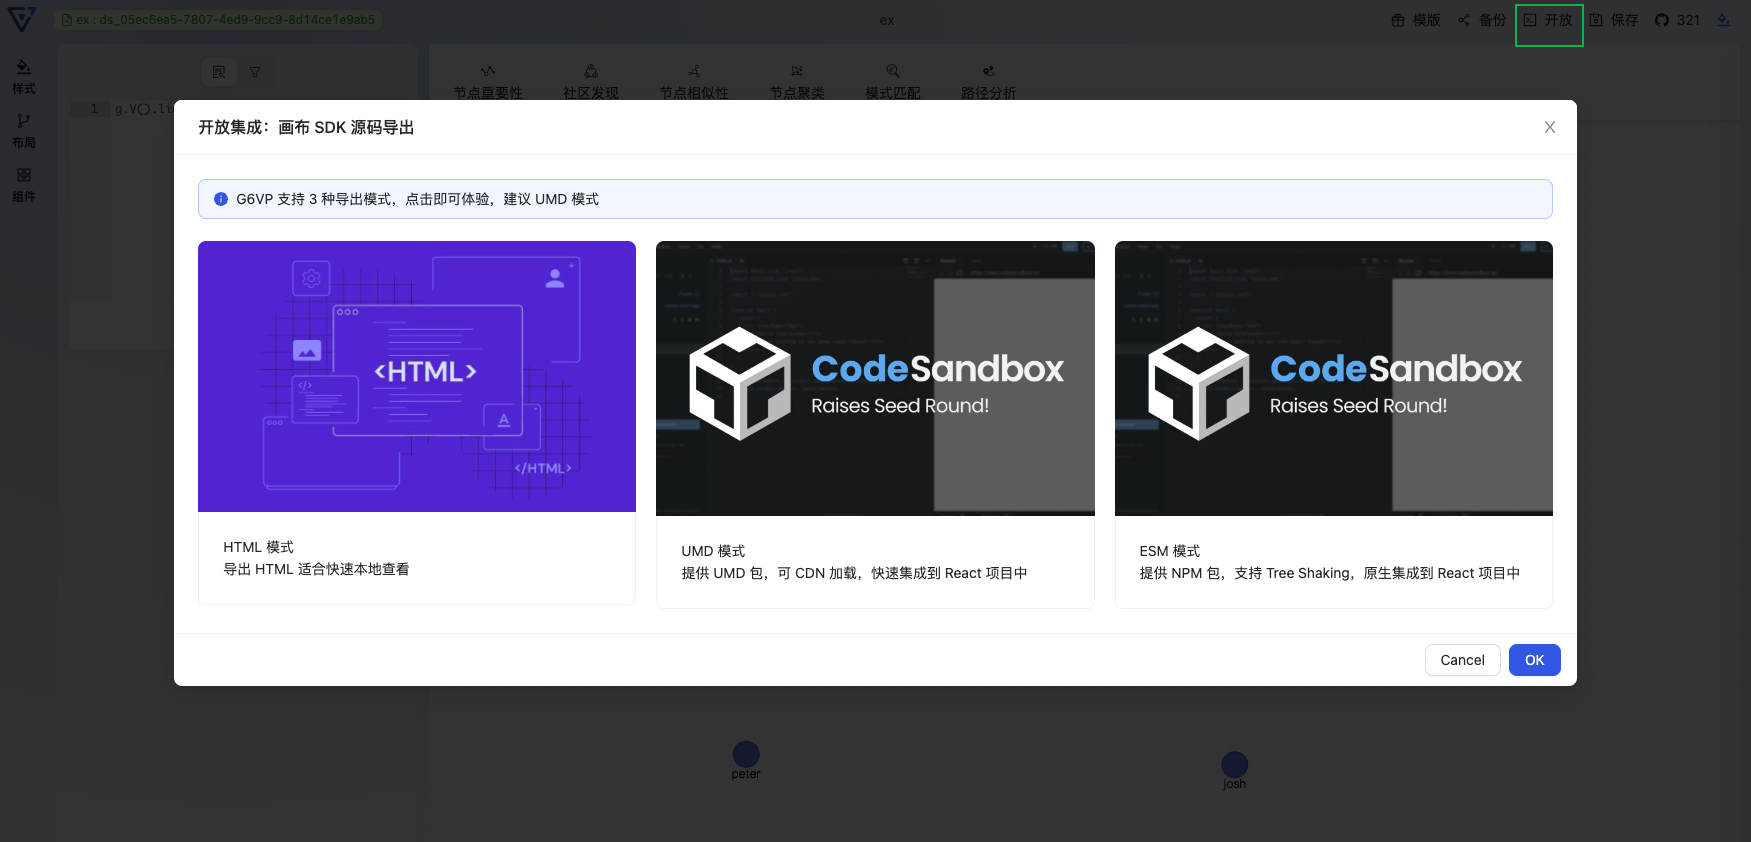
如果您想将这个工作簿嵌入到您的系统当中,可以点击右上角的「开放」,有三种方式可以导出:
If you want to embed the workbook into your system, export it at the right top 「开放」(Export). There will be 3 ways to export:
Hi,亲爱的 TuGraph 团队与用户:
Hi, Dear TuGraph team and users:
首先,非常感谢 TuGraph 团队为社区贡献了如此美好的产品!
First of all, we are so appreciate that TuGraph Team has created such a good product to the community!
我们是蚂蚁集团 AntV 图可视化小组。我们在去年开源了一款基于 AntV G6 (G6 官网)的图可视化与分析平台 G6VP。用户可以在这个平台上连接自己的数据,包括本地文件上传,或多种图数据库。然后在这个平台上使用我们提供的丰富的图可视化与分析资产,进行数据的分析。并且,G6VP 支持用户自由地、交互式地组装不同的数据源、图可视化与分析资产以设计和产出自己的图可视分析产品,甚至嵌入到自己的系统当中。
We are members of AntV Graph Visualization team of Ant Group. We have opened source a graph vis platform based on AntV G6 (G6's website)named G6VP, where users could connect to their own datasource with uploaded files or several graph databases, and then analyze the graph data with powerful graph visualization and analysis assets provided by G6VP. What's more, users could interactively integrate the analysis assets / components provided by G6VP to create their own graph applications and output SDK or HTML for embedding into their systems.
现在,G6VP 支持了 TuGraph 作为一个重要的数据源!非常感谢 TuGraph 团队的答疑和支持!
Now, we have supported TuGraph as one important datasource on G6VP! Thanks for the supports from TuGraph team!
下面是在 G6VP 上使用 TuGraph 作为数据源的步骤:
Here goes the steps to connect TuGraph on G6VP:
Step 1: 启动 G6VP 代理服务 / Start The Proxy Service of G6VP
我们假设您已经完成了 TuGraph 数据库服务的启动和数据导入工作。
In this step, we suppose that you have already accomplished the TuGraph Service starting and data importing.
由于目前 TuGraph 本地服务暂时无法通过网页直接跨域请求,因此我们需要启动本地的 G6VP 及其 http server,通过 G6VP 的 BFF 层进行请求。
Since the local TuGraph service does not support cross-origin requests through web pages, so you have to start G6VP http server, and then the requests will be transmitted by G6VP's BFF server.
这里有两种方式来启动 G6VP 的代理服务
方案一:下载 gi-httpservices.tgz 文件 / download gi-httpservices.tgz file
访问 G6VP 开源仓库,下载 gi-httpservices.tgz 文件:https://github.com/antvis/G6VP/blob/master/release/gi-httpservice.tgz
visit G6VP repo,and donwload gi-httpservices.tgz file: https://github.com/antvis/G6VP/blob/master/release/gi-httpservice.tgz
解压 gi-httpservice.tgz,进入文件启动服务,在此之前请先确保本机电脑有 NodeJS 环境
Unzip gi-httpservice.tgz and enter the file to start the service. Before doing that, make sure the NodeJS environment is available on your computer
cd gi-httpservice lsof -i:7001 // make sure port 7001 is available npm run start方案二:克隆 G6VP 源码启动 / Clone G6VP Source Code
克隆 G6VP 代码:
Clone the code of G6VP from GitHub by the running command in your terminal:
终端进入 G6VP/packages/gi-httpservice 文件夹
Enter the folder 'G6VP/packages/gi-httpservice' in your terminal:
安装依赖
Install the dependencies:
启动 httpservice
Start the service:
此时,G6VP HTTP 服务启动完成,访问 http://127.0.0.1:7001 ,(默认端口 7001),可以在控制台看到下面提示:
Now, G6VP http service is running, visit http://127.0.0.1:7001, (7001 is the default port), you will see the tips in the console of browser
Step2:连接数据库 / Connect TuGraph
进入 G6VP 站点的数据导入模块 https://insight.antv.antgroup.com/#/dataset/create?type=GRAPH
选择「图数据库」下的「TuGraph」,在表单中填写下面信息
Visit the website of G6VP, and go to the data importing module, at: https://insight.antv.antgroup.com/#/dataset/create?type=GRAPH ,Select TuGraph on the left, and fill the form
点击「开始连接」,若成功连接,右上方将出现下图提示,下方将出现「选择子图」 panel,「选择子图」的下拉框中列举了该 TuGraph 服务中的所有子图名称,选择其中一个子图,例如「default」
Click 「开始连接」(Connect) button and you will see the tip if it is success, and the subgraph select panel will be shown at below,Select a subgraph from 「Select Subgraph」. such as 「default」
Step3:创建数据集 / Create a dataset base on tugraph
再给选择的子图命名「movie」,然后点击「进入分析」,即可创建数据集成功,页面将跳转到「数据集」模块,您将在数据集列表中看到刚刚创建的名为“movie” G6VP 数据集:
give the subgraph a dataset name「movie」,and Click 「Enter Analysis」, the page will jump to the list of the datasets, and you will find the dataset you just created:
Step4: 创建分析画布 / Create an analysis workbook
点击对应数据集右侧的蓝色的电脑 icon,即使用该数据集创建工作簿,此时,页面跳转到新建工作簿页面,数据集和模版已为您填充好,在「工作簿名称」输入框为该该工作簿起一个名称,然后点击「创建画布」,即可进入工作簿。
Click the blue computer icon on the right of the dataset record in the list to create a workbook with the dataset. You will see the page below and the dataset field is already filled and please name the workbook and then click 「create an analysis canvas」
点击「创建画布」后,您将看到一个空白的画布,以及左侧的配置面板:
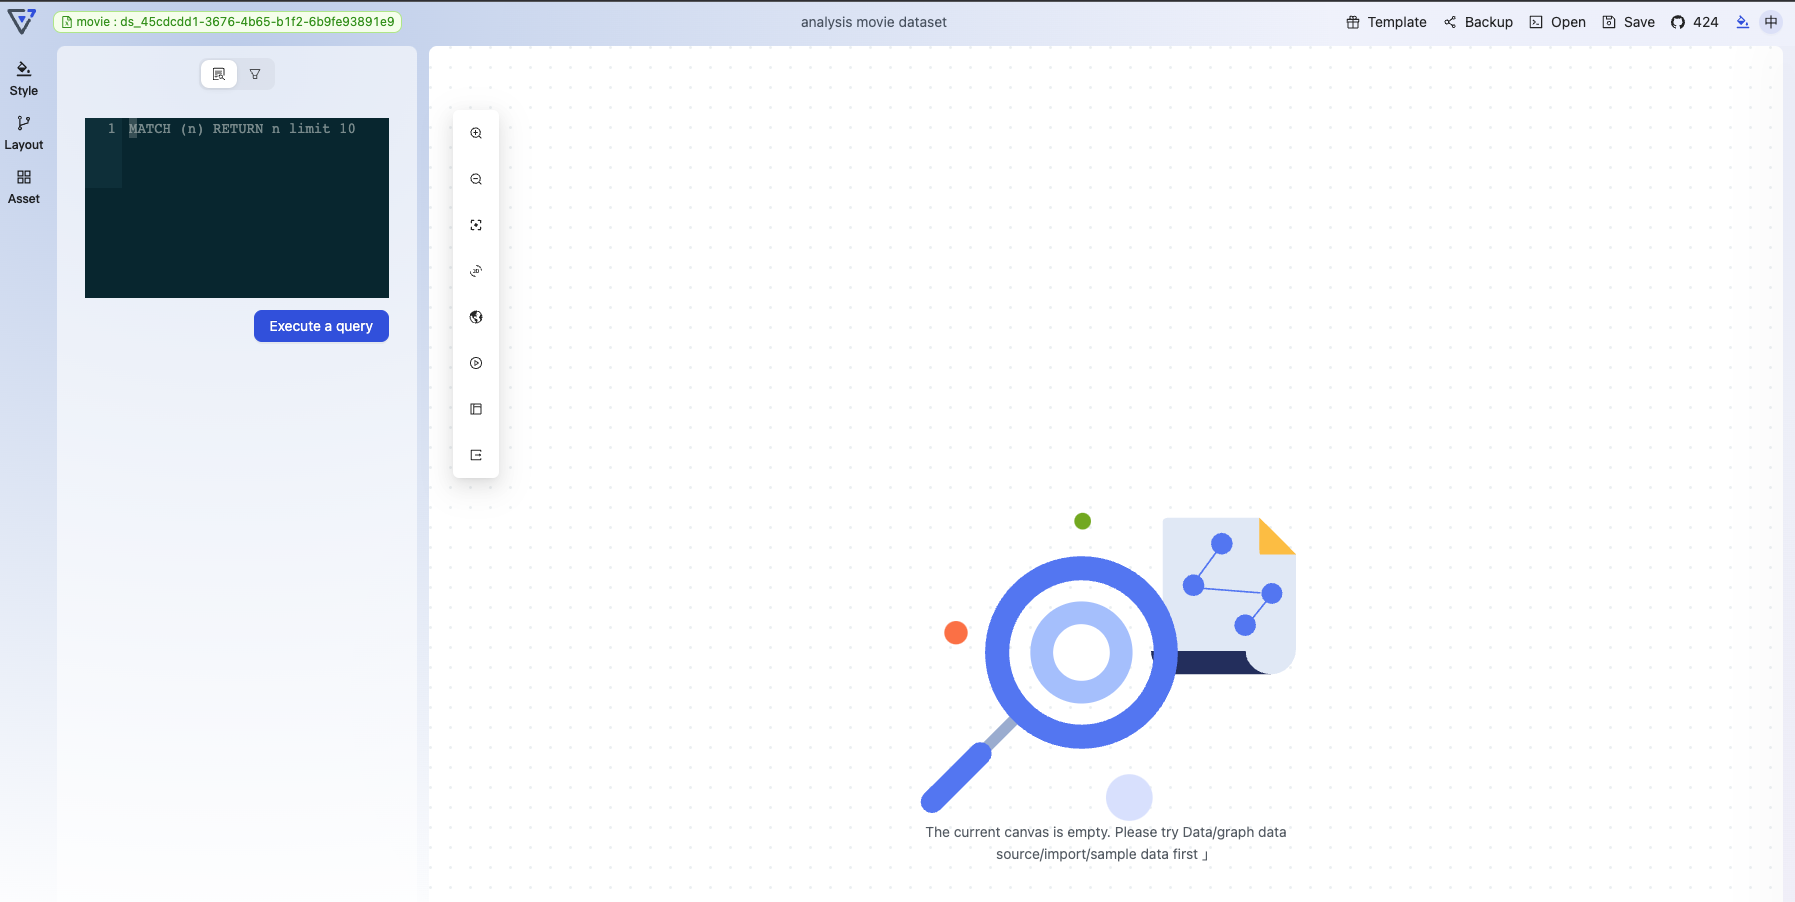
After that, a workbook is successfully created and you will see an empty canvas with configuration panel like this:
Step5:开始分析 / Analyze the Data
此时,您已经完成了 HugeGraph 数据库的连接和数据、工作簿的创建,可以在刚刚新建的工作簿中进行数据分析了。默认的「极简模版」中已经内置了 TuGraph 查询需要的「Cypher 语句查询」组件。例如下图中的
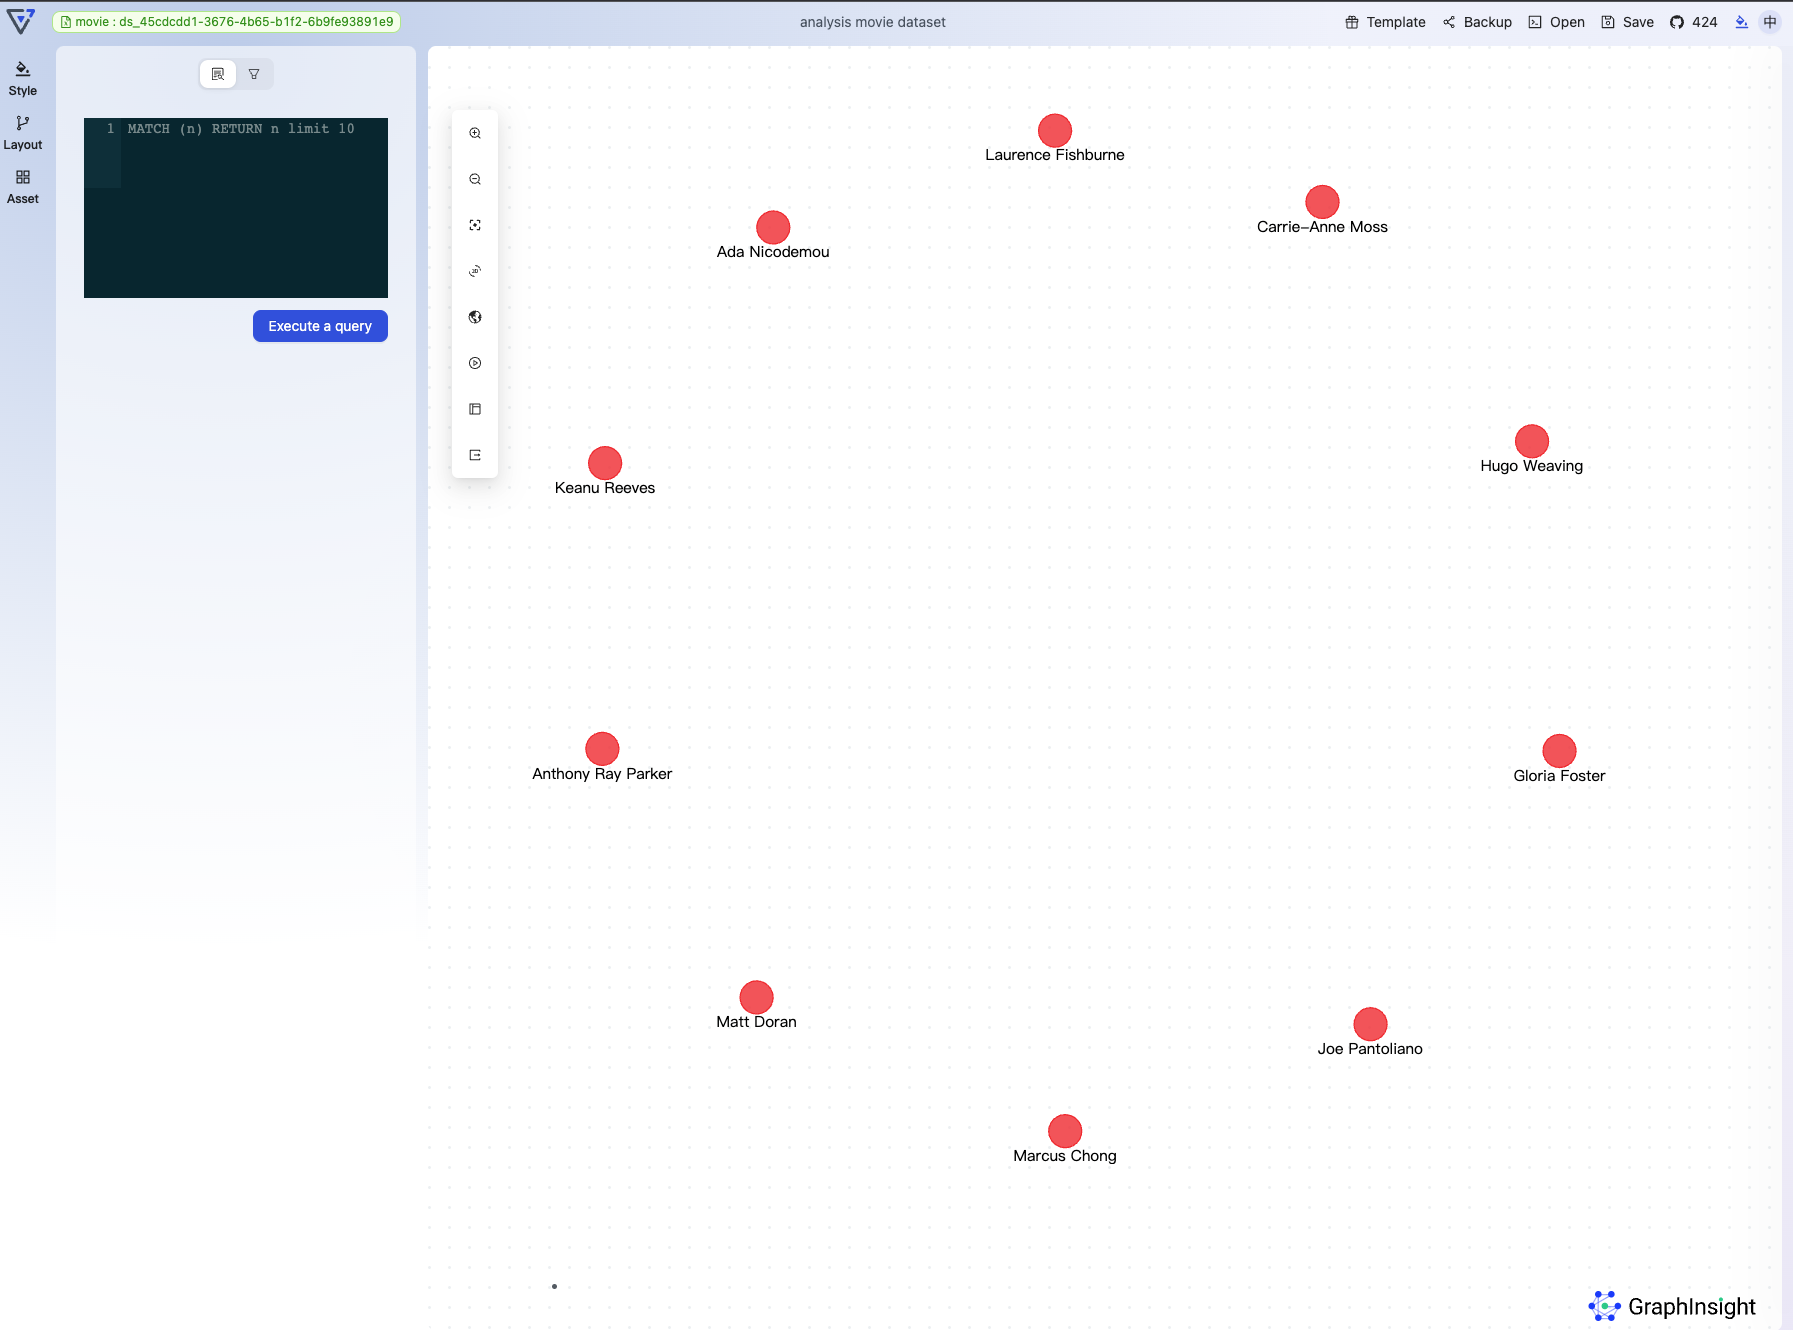
MATCH (n) RETURN n limit 10可以成功查询到十个节点:Now, you have completed the database connecting and workbook creating. Here goes the Graph Visualization and Analysis! The Cypher statement query component required for TuGraph queries is already built into the default "minimalist" template. For example,
MATCH (n) RETURN n limit 10can successfully query ten nodes:如果目前节点和边的样式不符合您的要求,可以在「样式」中进行配置:
If you are not satisfy with the nodes and edges' styles, configuring it on the style panel on the left:
单击一个节点,可查询其详情,并显示在属性面板中:
Click one node to see the property panel:
选择一个或多个节点,在节点的右键菜单中,选择「一度扩展」,进行该节点的邻居查询:
Select one or brush multiple nodes and right click to expand the neighbors:
扩展结果:
The result after expanding:
如果这个邻居扩散资产不符合需求,可以在左侧面板进行配置:
Configure the neighbor querying asset on the left if it does not meet the requirement:
使用过滤取来分析统计数据,我们提供了过滤器的智能推荐:
Use the filter to analyze the statistical info, and there will be an intelligent recommend:
上面仅仅介绍了最为基础的功能。还有大量超酷的图分析资产可以在资产中心找到,你可以集成这些资产到不同的容器中,来设计和建设您的图应用:
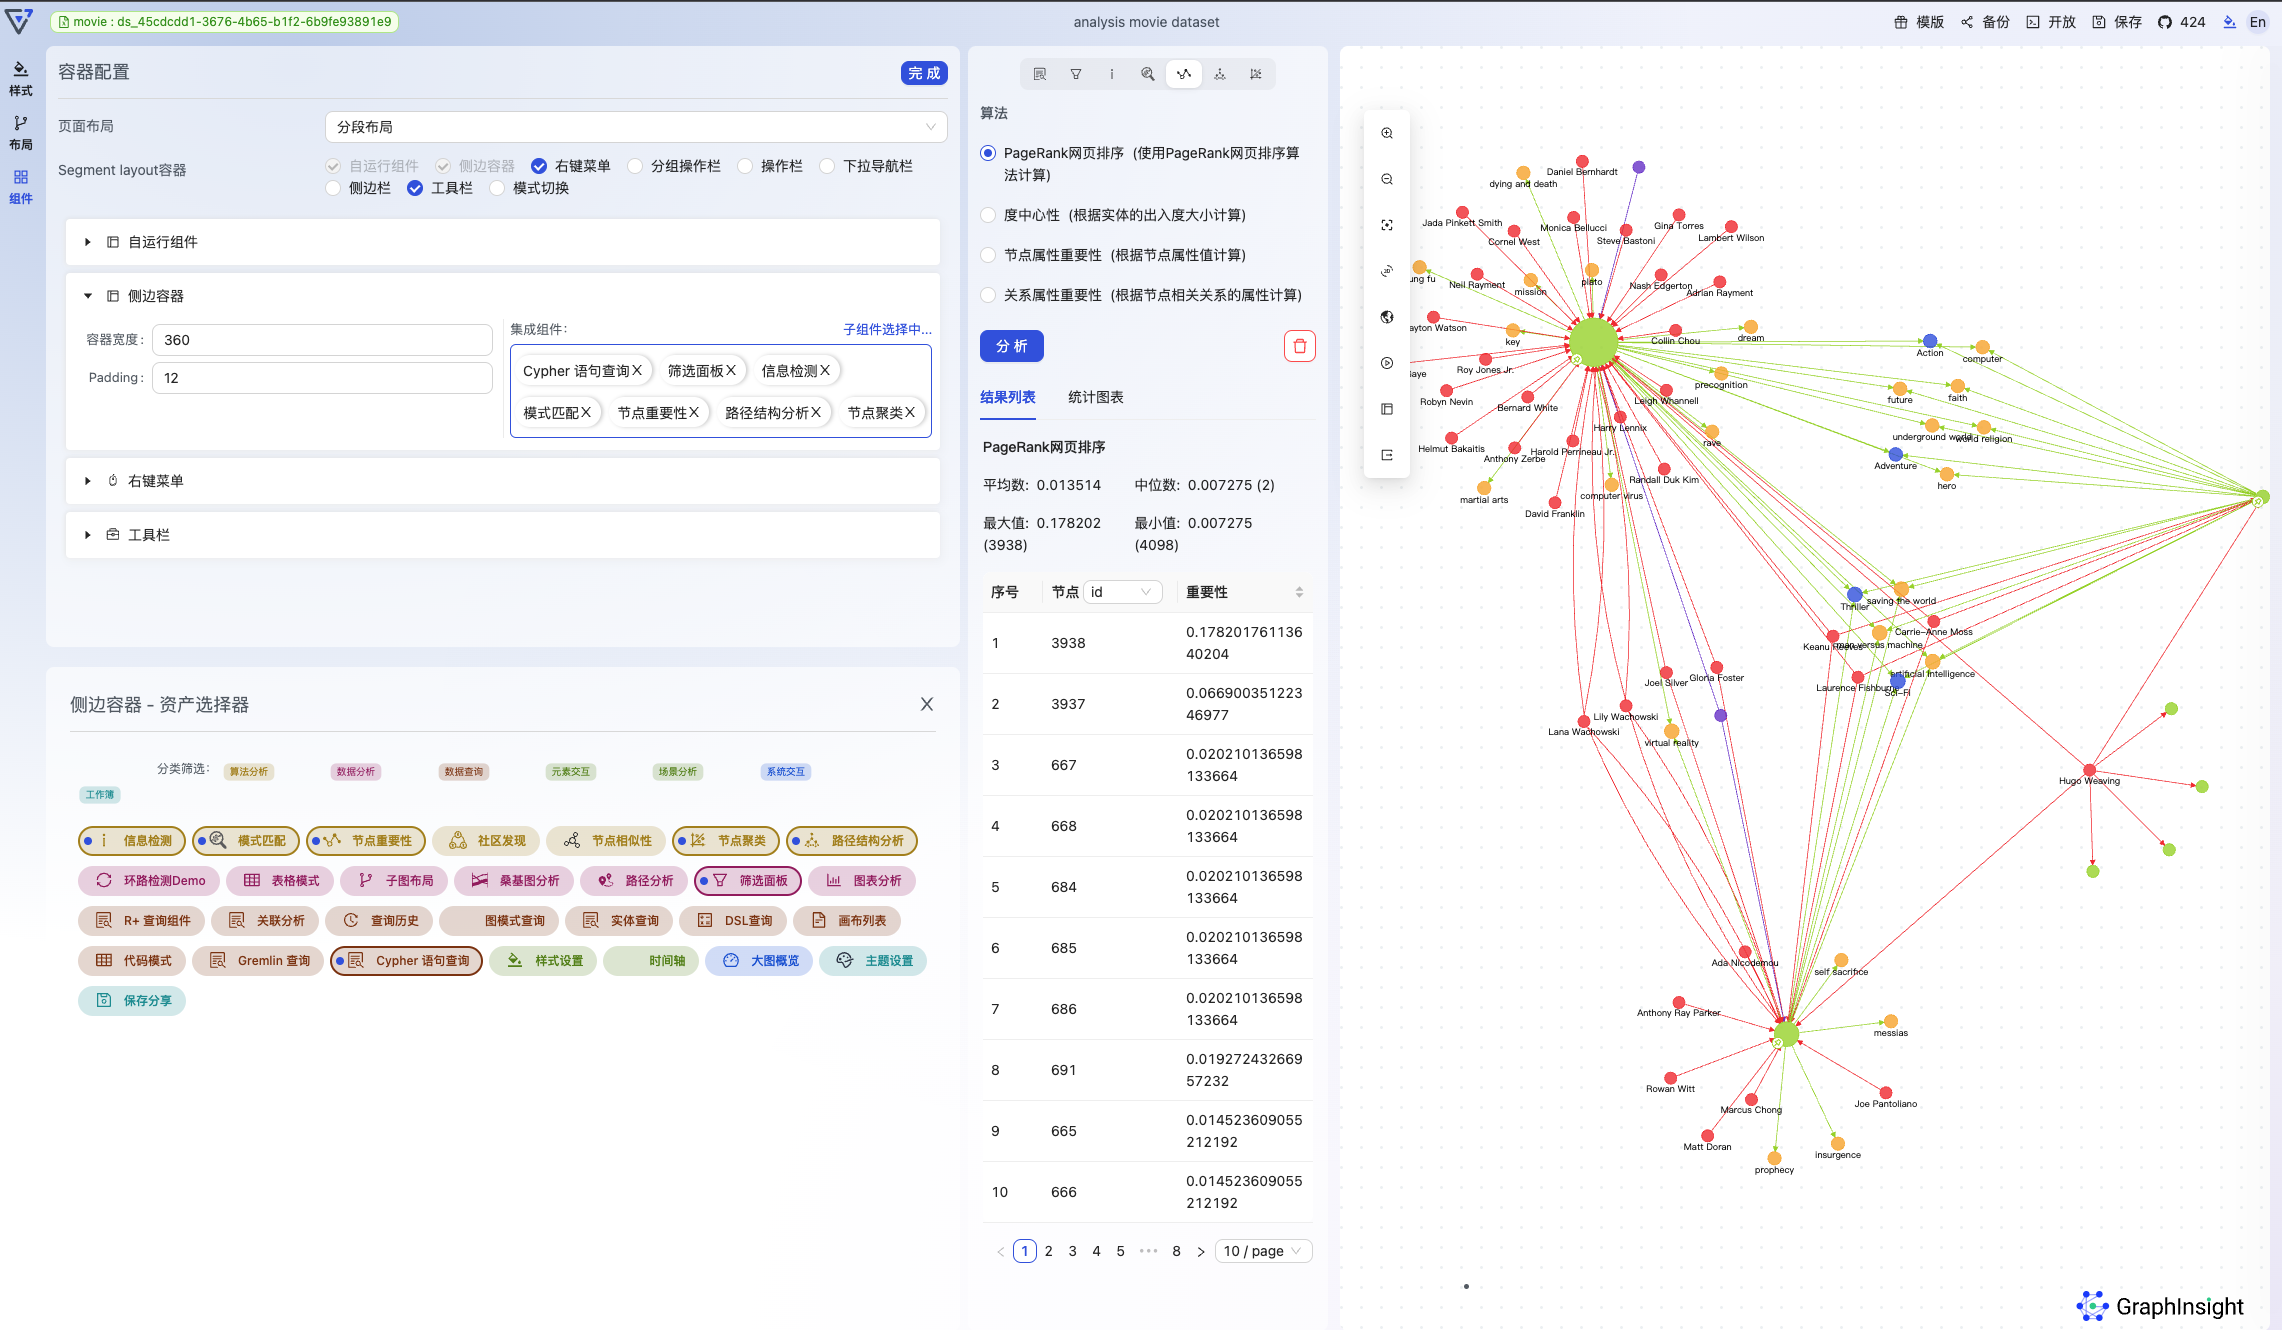
The introduction above is only about the basic functions. Plenty of fancy graph analysis assets will be found at the assets center,you can Integrate them into different containers to build up your own applications:
最后,别忘了保存刚刚配置完成的工作簿:
Last but not least, do not forget to save your workbook after the above operations:
次进入 G6VP,就可以在工作簿列表中找到这个工作簿了。别担心,所有的数据信息、工作簿配置信息都存储在您的电脑本地缓存,G6VP 不会获取任何用户数据信息:

Next time you visit G6VP, you will found your workbook at the workbook list. Don't be worry, the datasets info, workbooks are all cached at your computer. G6VP will not record any user information!
如果您想将这个工作簿嵌入到您的系统当中,可以点击右上角的「开放」,有三种方式可以导出:
If you want to embed the workbook into your system, export it at the right top 「开放」(Export). There will be 3 ways to export:
更多的用法和文档可以访问:https://www.yuque.com/antv/gi
More usage and docs can be referred to: https://www.yuque.com/antv/gi
如果您有任何问题,都可以到我们的 GitHub 仓库中提 issue: http://github.com/antvis/g6vp
If you have any questions, create issues at our GitHub Repo: http://github.com/antvis/g6vp
您的 Star 就是给我们开源最大的鼓励:
We will be appreciate if you star our repo for encouragement:
祝您开心~
Have a nice day~
The text was updated successfully, but these errors were encountered: