[Feature Request] Performance Overlay Improvements #4500
Comments
Disclaimer: I don't know what I'm doing, I may be wrong about any of this.The PPU0/PPU1 thing is not possible as you say it. These represent physical cores on the PS3 and RPCS3 doesn't emulate scheduling of PPU threads on "physical" cores like lv2 does, it has one host thread for every guest thread. Not as sure about SPU's case, but I think there's one host thread for every emulated SPU core, though that doesn't mean it's as simple for an emulated SPU core to be convertable to a % number, there's plenty of other managerial threads related to SPUs. That said, I experimented a bit doing it in different way (everything is a WIP), I suppose you'll see a PR in a few days/weeks, if it turns out to be a good solution. To add to your suggestions: Graphs! |
|
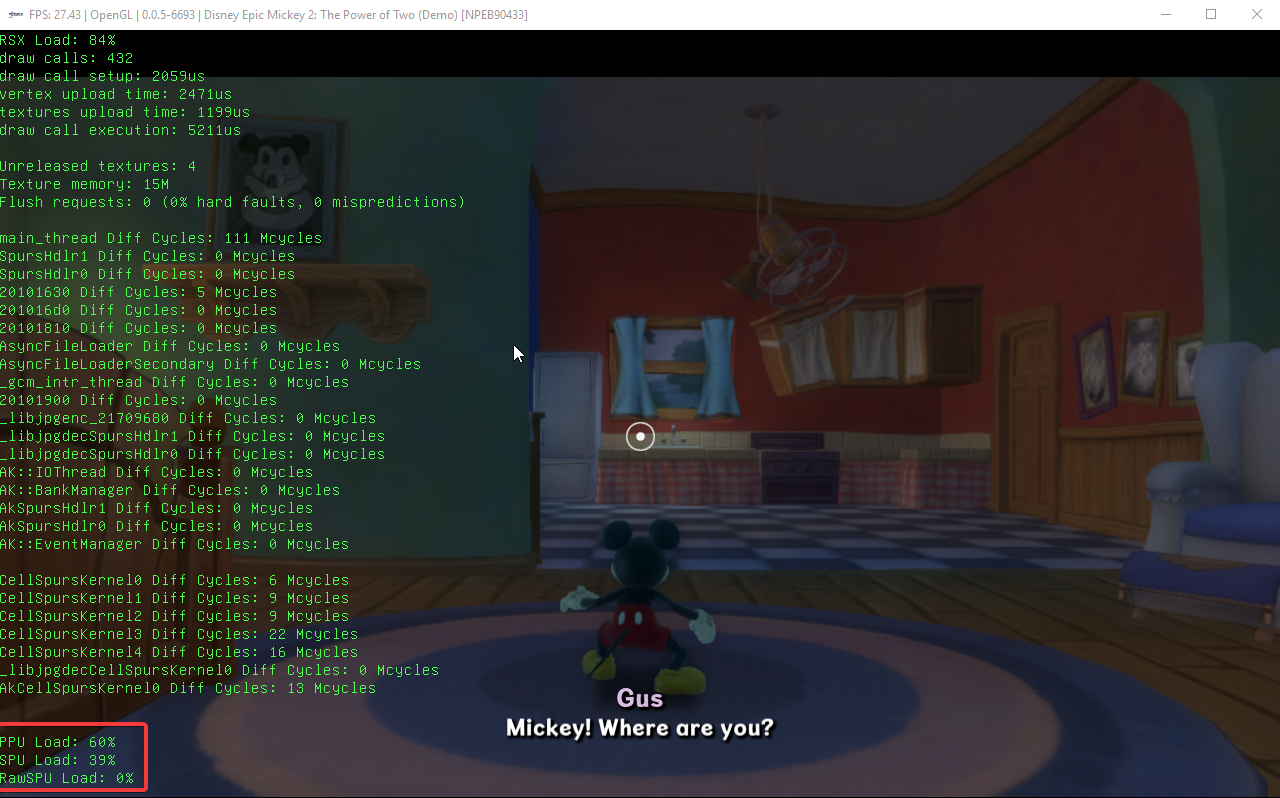
The image you attached looks promising. I do wonder though what are the details behind it and how does it gauge the load. If I understood you correctly, you said that the emulator just opens threads to each ppu/spu core respectively, and lets the OS's kernel handle the scheduling and the rest, so since it's not particularly limited by the original Cell's hardware capabilities, and thus one cannot gauge the load? The point would be of course, is to make a three-way load counter, with which one can see what is causing the slowdown, what is bottlenecking the emulation. This means that they would scale relatively to each other, and something would always be at "100%" (when not framelimited). Is this also the idea behind yours, or do you have a different motivation/approach? I'd like to know the plan (but of course, my understanding might prove to be pretty limited). |
I basically use Sidenote: Annoyingly that function uses the Anyway there's been some progress since yesterday, I now scale it by RPCS3 process CPU usage which results in absolute %, instead of what you saw above which sums to 100% (it doesn't exactly sum above because there's a few other thread groups not accounted for atm, but you get the point). Not sure if I'm gonna keep that, what do you think? Also I'm experimenting using kd's native overlay system to make it prettier. |
|
So depending on how many cycles the rpcs3 uses, the formula basically went form this: PPU: ppuThreadGroupCycles * 100 / rpcs3TotalCycles to this? PPU: (systemTotalCycles / rpcs3TotalCycles) * (ppuThreadGroupCycles * 100 / rpcs3TotalCycles) (I just named these things symbolically, as I dont know how to reference them.) Or was it more like: PPU: ppuThreadGroupCycles * 100 / (ppuThreadGroupCycles + spuThreadGroupCycles) this? I think there are caveats to each of these. I will highlight two:
After thinking it through, this is what I came up with, based on some assumptions: Assumptions:
Based upon this, it would all add up to the percent of which RPCS3 uses the available cpu time. If it uses all of it, (so we are on "100% util"), they would add up to be 100%. If the framerate is locked, then this would go down, as the program will no longer crave for that many resources. After that, maybe it should be normalised to that max cap, using the max of the three percentages (it would no longer add up to that max cap after this ofc). An illustration of what I mean:
This way, two things are shown: the fact that how much of a toll the whole emulation is taking on the system, and also the culprit. This is just me theorizing though. I'm also fairly certain that RSX's cpu toll cannot be checked this way, but I don't know how the RSX util counter is currently implemented. On the topic of RDTSC, if I understood you well, yeah, it shouldn't matter since we compare them against each other. Sounds pretty good though, kd's overlay would be a nice touch too. Also, if I said some huge horseshits in this, I'd be happily stand corrected. Not sure what to do with RSX btw, as my theory only cares about the cpu side of things - but I do think it should be integrated to this gauging process in some way or another. |
|
It's sort of a cobination of both formulas. Deriving
There are, as i said it's using an instruction all cpu's have.
I've done a bit of research and it looks like it's the best way to measure what we want.
I feel like my current suggested way of scaling all values with rpcs3 process usage achieves the exact same thing, do you disagree? You can still see whihc value is the biggest, I don't understand your argument. It's also just more intuitive imo, all of them roughly adding up to process usage.
It works by manually measuring idle time when waiting for semaphores, fifo etc and elapsed time and inverting that percentage. Current progress, btw: |

|
Oh I see. Looking good too, and about the formulas, I think it's fine either way. What is RawSPU by the way? |
|
A way for games to use SPUs without lv2 managing everything. |
|
Rsx load isnt a simple cpu load metric but more of the virtual gpu load. Its relative to the emulated system and not the host, e.g in a fifo busy wait situation, guest gpu load is 0 but host load is 100. In that situation the host load is kinda false (rsx loop is at higher priority than the other threads to discourage preemption and microstutter so it will always have high cycle times). If you want to measure host rsx::thread load (cpu) you may do so just mark it as a different metric. Ideally guest load is what we want as it helps focus optimization, but I guess host metrics can help with config tuning for savvy end users. |
|
@kd-11 Yeah I've found it quite nice work with. A few issues I've come across is definitely the need for refactoring as you mentioned and the fact that font rendering is a bit buggy. It's offset from specified coordinates - I believe you try to handle that here but it didn't seem to work in my case (maybe because I'm using a different font size?). I needed to hackily offset the text down manually by using negative padding. Also, some characters seem slightly offset from the rest (ex. in the PPU line see "L" and "oad"). sbt_truetype issue?
Yeah that's what I'm doing. It's marked as "RSX Load" like the debug overlay, not sure what else to mark it without being too verbose, this is meant to be for users after all. Progress pics:
Full size
Full size
Number in parentheses is thread count. In the CPU usage line it's the process total and RSX is hardcoded to 1 for everything to be uniform :^ WIP commit here. Feedback/suggestions welcome of course. |


|
Looks nice. Some notes:
I procrastinated refactoring and improving the native interface for too long - I'll do it immediately after finishing the current PR to make it more usable for general stuff like this. There are a lot of object lifetime management issues with it that I don't like, and some other stuff like generating UIDs for front-end resource management is not yet done. |
|
How about making 2 seperate sections, one for host stats and one for guest stats? Wouldn't that disambiguate the different RSX loads? |
|
It would work just fine. Something like |
|
@tgenigma: It would, but I think it should also be stated that it's 'CPU Host Load' too, so there won't be any misunderstanding regarding (host) GPU utilization. How about this maybe?
(Maybe this wouldn't be very welcomed since as I see you (@VelocityRa) try to make it as tabular as possible, and the former would break the uniformity of the design quite a bit. Also, I removed Overall from the guest load, since it wouldn't make sense there. I don't know if PPU and SPU guest load can be measured though, but kd already wrote about this.) Edit: mentioning the CPU (like i7-4770K) [or even the GPU] is not a bad idea btw, would help lots when people just upload things to #media and Youtube, without any info added. Edit °2): oh, I forgot to mention: maybe the thread amount could be hidden by default. Might appear to be confusing without some description / prior knowledge on what it does. Source: self :) |
Hm yea. I gotta go, but I have an idea for a design sort of like that, I'll try it later.
That's pretty much what I did initially, actually but I after getting weird results I realised it's not exactly what I wanted so I scrapped it. Maybe I should have it in addition to host/CPU usage stats, since you suggested I add actual guest RSX Load. |
|
Changed layout and font: Not gonna do PPU Load because then I'd also have to do SPU and I'd rather not get into that. Maybe later on. @nitrohigito I don't think sysinfo would be very useful there tbh (even if I trim it and stuff):
How about: Also made title color different:
|


|
The title color is definitely a nice touch, I like that, and the new layout is great! As for the namings of the categories, I'd personally pick the ones I wrote previously, but that's just a minor nitpick. About the thread number: I proposed an extra tab to the Qt frontend in the original post, where one could fiddle around with the settings to control what info is shown or not - that's what I meant with the thread count being hidden or optional. I don't mind it per se, I just think of it as you think about the sysinfo. The latter of which I imagined along the lines of: i7-7700HQ / GTX1060 - so not that detailed as shown :) That being pretty much noise, I agree, but this could also be optional. Then again, lot of things could be added as optional, I just don't want to overwhelm you with these :D Especially since it can be added later on, so it's not a top importance right now. One more thing: I noticed it in your previous post, that the overlay on the P5 title screen is pretty tough to read. I don't know what could or should be done about it, maybe some font shadow would help. What do you think? Btw, how difficult would be to add GPU load alongside with the CPU load to RSX host? Would it need custom code, or is it readily available? |
|
Your titles are better but then I'm not sure where to put "Threads #" - maybe I'll scratch that entirely. I talked with Megamouse and he's going to restructure the Setting tabs, so there will be space for any options that might be needed. I don't intend to work on the GUI side of things very much though. About the visibility, I suppose I could make the background a bit more opaque. GPU stats as you suggested aren't easy to come by and afaik are not readily available in the codebase at the moment. |
|
How about giving the text a dark outline so you can read it no matter the background? wouldn't need the square background to make it readable then. |
|
@VelocityRa I went ahead and created a mockup in Photoshop, so you can actually see what I'm thinking of. I did steal your color palette to some extent, as I thought it looks pretty baller :).
Here's how I made it: Sizing:
Font, font color and opaqueness:
I tried to make it as reproducable as possible, hope it helps. How'd you like it? On the last part, I think it wouldn't be an issue if the GPU load and the likes wouldn't be available at first, I just don't know how should I/we keep track of what's left to add. Maybe I just won't close this post immediately, and we can keep track of them here. |


|
Performance overlay was merged some time ago, please update with remaining features or close this. |
|
Updated, thanks again for notifying me. @VelocityRa If needed, I could reach out to you on Discord to discuss this more efficiently. This is of course only if you want to keep improving the performance overlay with these crazy and overly elaborate ideas of mine :) |
|
@nitrohigito Yeah that'll be easier, I'm online atm, 'velocity' in members list (Contributors). |
|
1 is possibly fixed by #7728 ? |
|
And 11 is fixed by #6974 of course. |
|
Closing as by and large resolved. Thanks for velocity for implementing the perf overlay + the 2 graphs. |
Hi!
Now that performance overlay has been implemented (huge thanks to @VelocityRa), I've updated this post with some minor and some major, more long term goals.
1, fixing the asnyc nature of the overlay:
Having set the overlay to update at every 30 ms, in some cases it might miss this time window, and refresh late. This is unfortunate, as one of the main goals of having a performance overlay is to show dips in performance - something it won't be able to do, if the overlay's refresh dips with the game itself.
2, fixing measurements while other overlay events happen:
This one's a bit tricky. I noticed two things: the performance overlay is active during the startup phase, where shader loading happens; and when the performance overlay halts while an on-sceen display dialog is showing, it incorrectly displays a dip right after the dialog closes. (e.g. when NIER asks you to name your character) This might cause unexplainable dips when assessing logs (see below later), so it'd be nice to have it fixed.
There also might be a slight performance penalty when the overlay is turned on, but that might have been just placebo, as I haven't done any investigations.
3, per-frame updates:
The overlay's refresh rate can be set at an n*10 ms basis, which is not a bad idea, but I think having it refresh on an 'every x frames' basis is more preferable. Either having the option available, or having this exclusively, would be a welcome addition.
This does reveal another issue however: does the load % counters need to be actually updates that often? The answer is, well, yes and no. If the value is updated fast enough (like in every 16.6 ms), the actual dips might go unnoticed, as the counter refreshes itself before the user could notice it. On the other hand, if the counter is not updated frequently enough, the dips won't show at all to begin with. After thinking about it, I've arrived to 4 possible routes to take on (all of which I'll address right below), but I'm heavily open for discussion.
- not-all-encompassing updates:
This route is pretty basic; there would be a toggle for either the groups of counters (like host counters, guest counters, frame counters), or the individual counters - and each of their update intervals could be addressed on a one-by-one basis. This gives the user a lot of freedom on how to configure it, but it also might result in a configuration hell, cluttered config UI, and might scare away beginners from actually using the thing.
- dynamic update intervals:
Now this one sounds easy enough on paper, but might prove to be very difficult to implement. It is known, that the human perception to changes is logarithmic in nature. By exploiting this, the overlay could update when an 'important enough' change in the counter values occur, and not when no such thing happens. This would provide an inconsistent interval of counter refreshes, but would preserve the goals of actually using the feature to begin with: showing dips and actually relevant information, while hiding non-important, 'basically static' info.
- frametime (and possibly other) deltas:
This one will probably sound obvious enough, so here we go. With or without showing the actual values, we could show the delta of the current and previous value of the counters instead. This would still deliver a consistently updated output, while also enabling more-or-less well-percievable changes and dips of values.
- graphs:
Graphs could also provide a solution, but I'd prefer having them alongside other options (and it is more of a long term goal), so they'll be discussed later down below.
4, new counters:
- short term:
The addition of a RAM and VRAM counter would be awesome! On my main machine with Chrome open, I regularly run out of memory, which results in some surprised faces. I think this would be a minor addition, so I think this is a short term goal. I'm not sure if the counters should compare to all the memory the machine possesses, or just the memory that's available for the emulator, but I do think the latter would be preferable.
Not sure how this works currently under the hood, but if it matters, an input latency counter could also be placed. Needs more investigation.
- long term:
In the long run, other metrics could be added as well, like temperatures, clock speeds, and GPU utilization. I'm not sure if IO should be a thing, or just how to measure the IO-boundness really, but during loading screens I figure IO must play a role in slowdowns, so that too.
5, further configurability:
Now, #4727 does expand the available options quite a lot, but I think full configurability would be preferable, compared to detail levels. This means that every piece of information could be hidden or shown ([graph design and visibility], FPS, frametime, fps delta, frametime delta, cpu percentages, cpu deltas, thread reservations, guest percentages, and the likes). This will probably result in the overlay to be moved to a tab of it's own. Not sure about the user-friendlyness of it, but I think with good defaults and tooltips, this would be doable. Maybe the addition of a sample photo, and showing how each setting affects it would help this even further.
6, audio:
Audio is a hard one. I'm not sure what kind of visual clues could be made to aptly display audio issues, especially since there are many kinds: latency, desync, screeching/glitching, etc. Any idea is welcome.
7, hotkeys:
Hotkeys are awesome. Toggling the overlay with a game restart however, is not so much. That is why I think, that having an option to toggle it while ingame would be a huge addition. If the classification of the overlay detail levels are kept, it could even toggle between those and off, just like in video players, like MPC-HC. Not sure how to make this happen with a controller, but I figure that with exploring unlikely (yet not uncomfortable) button press combinations, this could still be a reality there too.
8, preciseness:
This is not really a feature request, more like a point to discuss. There have been known cases where the FPS counter in the title bar showed incorrect values. Is the current overlay immune to those issues? Is this overlay as, or more, precise than any other 3rd party overlays? I'd like to know.
Also, I'm not sure how doable this is, but is reaching an FCAT level of preciseness possible? It would be pretty nice to have a counter that displays runt, torn and skipped frames, while also being sure that it is precise to the end. (See the .pdf in the 'FCAT Reviewer's Guide for further explanation.)
9, logging:
In order to make stability comparisons easier (and to attract reviewers/youtubers/influencers a tiny bit more), a performance logging feature could be implemented, that creates a csv with all possible data attributes logged, frame-by-frame. This might already be implemented, but I couldn't really find it.
10, fixing the key issue: the visual clues of having non-target performance:
Yesterday, I've been trying my hands on NIER [BLUS30481], and what I've noticed was that even though no performance counters peaked, I was still not getting the targeted performance. Since one of the goals of having a performance overlay is to display what's causing a dip, this means that currently we are failing this goal. I've already addressed this to some extent at my 3rd point, but this is more subtle than that. This means, that whatever is causing a slowdown, there isn't a counter or any other visual feature to show it.
While I'm not sure how the emulator works and what can cause it to miss the perf target (I haven't read the source yet), I did came up with two major ideas to display it, whatever that cause might be.
- the worst offender list:
This would be a small, maybe 5 line list, that'd have the reason for the most recent hiccup on top. This might be thread-to-thread latency, locking, IO waiting, a thread being overworked, whatever. It's a pretty barebones solution, but if it works, it's not stupid.
This could also include the shader compilation message, so it would appear on the list, and wouldn't appear at the bottom.
- graphs:
And indeed, graphs!
11, performance graphs:
Graphs would be pretty neat. In the recent showcase of NIER, the MSI Afterburner's (more specifically, RivaTuner's) graph was shown to illustrate the unevennes of the frame pacing - and it did a hell of a job at that. This frametime graph could also be combined with the 'worst offender list' as a legend, mentioned right above, and become a stacked graph. If done right, this (combined with a skipped/runt/torn frame counter) would show every single issue, that could ever come up with (graphics) performance.
This is pretty much it. If I have missed something that's already in, or any of these have practical limitations that makes them impossible, let me know.
Thanks!
Updated as of 2018/06/09, when PR #4727 was still active and not yet merged.
The text was updated successfully, but these errors were encountered: