- File : Reset Colors, Quit
- Reset Colors: Reset the color of the device's Graphs to the default.
- quit: Quit the application.
- View : Refresh, Update Speed, Graph Direction, Show/Hide Devices
- Refresh : For accomodating a new hardware related change such as network change.
- Update Speed : Speed control for performance tab.
- Graph Direction : Newer on Right(default) / Newer on Left
- Filter: To Filter out the unwanted processes.
- Show/Hide Devices: Can be used to hide or show the device of intereset.
- Tools: Log Plot(To visualise the data collected using Record)
- Help : About, What's New
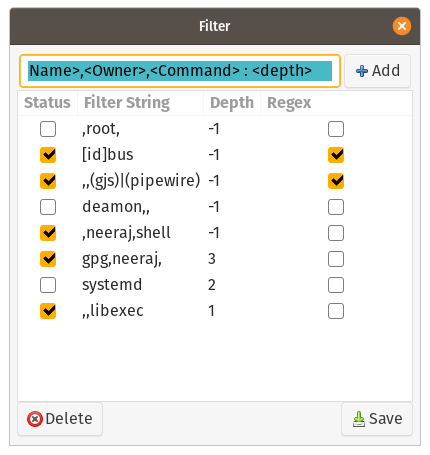
Filter filters out the unwanted system/user processes by using custom filtering words which can be defined in FILTER dialog.
Column description:
- Status: Shows the On/Off status of the filter word of the row.
- Filter String: Word/String to be used for filtering. String is matched in Name, Owner and command column.
- Depth: Since the process are shown in Parent Child fashion, depth depicts the level of this hierarchy.
- -1: The parent(first process to get matched with Filter String) along with all of its children process are filtered out.
- 0: Effectively no filtering is done for the matched process.
- 1: Only the process with a match is filtered all it's child are not effected.
- 2: With the matched process all immediate children are also filtered out.
- and so on.
- Regex: Whether the Matching is done using regular expressions(the Filter String will be treated as regular expression) or not.
Certain syntex and sementic rules need to be followed to use Filter:
*spaces at the start/end of the word will be ignored. Duplicate Entries are ignored
Type I:
<String> : <Depth> OR <String>
Where String will be matched in process Name, Owner and Command. A match in any of the field will considered as a Filter match and that process will be filtered out with its child defined by the depth. The Depth field is optional and default value is -1. Matching mechanism if regex is OFF would "String1 in String2" and if regex is ON regex match would be performed.
Multiple Entries Can be added at one time by using ";" between entries.
root:-1 ; libexec ;gpg:4
Type II: Use of segregating two ",(commas)" are must.
<Name>,<Owner>,<Command> :<Depth>   OR   <Name>,,  OR ,<Owner>,<Command>:<Depth>  OR  ,,<Command>   OR   <Name>,<Owner>,
OR any Combination with same pattern.
Where the String at Name, Owner and Command fields will be matched against respective columns in the process table. A successful Filter match will only occur if each is String field is matched successfully in their respective process column fields. When any of String field is empty that will be not be considered for matching and others are tried with their respective columns. The Depth field is optional and default value is -1. Matching mechanism if regex is OFF would "String1 in String2" and if regex is ON regex match would be performed.
Multiple Entries Can be added at one time by using ";" between entries.
root,root,root:-1 ; libexec ;,,gpg:4
- A Enter and click on "Add" button will put the filled entry to the list.
- To make the change appear in the Process Tab immediately after adding entries then Save them with Save Button. Otherwise the changes will only appear on the next time of spawing the sysmontask.
- Entries can be deleted by "delete" button but the entry ",root,:1" can not be deleted.
**Ubuntu:**
  * GNOME: "root:1" ; ",,libexec:1" ; "[id]bus:-1 " ; "(gpg)|(gjs),," ; "pipewire,," ; "daemon" ; "systemd-"
  * XFCE: ""root:1"" ; ",,libexec:1" ; "panel\-[2-9]" ; "lightdm,,:4" ; "daemon"

**Linux Mint**
  * CINNAMON: "root:1" ; ",,libexec:1" ; "systemd:2" ; "lightdm,,:4" ; "daemon"
  * XFCE: "root:1" ; ",,libexec:1" ; "panel\-[2-9]" ; "lightdm,,:4" ; "daemon"
In case of filtering out the processes, the parent and the hierarchy get changes a bit. To understand, let's assume a tree A->B->C, where A is the root parent(can be a another tree), B is another child(can a sub tree having one or more process as child) and C leaf cluster(one or more process/subtree). Now using Filter if the subtree B get filtered out but its child which is C is not affected then after filtering out A will become the new parent of C ,i.e. A->C . In case you want to add the filtered subtree B back by disabling Filter, the hierarchy will restrore back, i.e., A->B->C.
NOTE: Using without Filter will show all the processes. Since python is not a Fast executing language, the CPU utilisation will be more than 1% in steady state. Using Filter to remove all root process reduces the burden a improved performance can be seen. Hence for low end systems use FILTER.
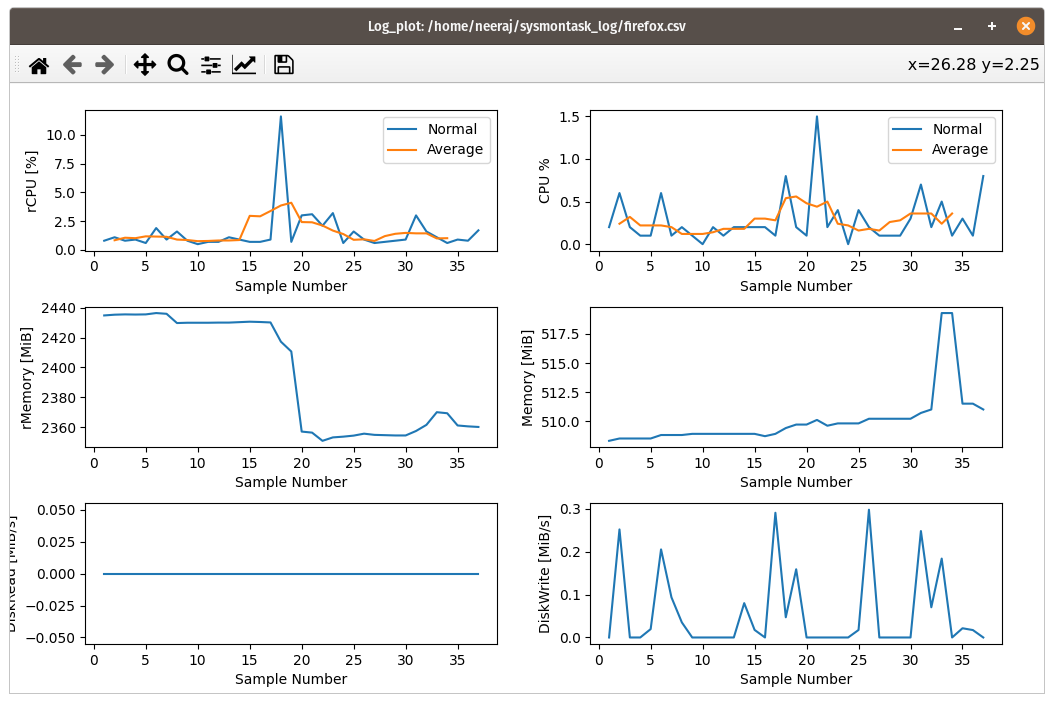
The Process metrics such as CPU,rCPU and Memory etc. can be recorded and also it can be visualised in graphical form using sysmontask.

Using the red toggle button at the bottom right corner, recording can be started for the selected process. CPU, Memory and Disk details will be stored in <process_name_<date and time>.csv file at $HOME/sysmontask_log directory.
Recording can be paused using the pause button near the Record button.
It can be accessed from Menu->Tools->Log Plot. A Browse File window will spawned using which the file in $HOME/sysmontask_log can be selected after which the Graphical Window will pop up to show data.
Note: For visualising the data, matplotlib(python3-matplotlib) is used. Since the matplotlib download size is more, to reduce the overall standalone sysmontask size, it has not been including as dependancy and will not get install automatically. In case you want to use LOG_PLOT, install with pip3 or package manager:
sudo apt install python3-matplotlib OR pip3 install matplotlib
For a on going recording, to use the Log_Plot, first pause to flush the contents and then use Log_Plot. after that you can unpause it.
- Processes are shown in Parent and Child relation with filtering algorithm to filter out the background processes that are not as useful as the process that the user creates. Processes which have their origin from "/libexec" or has "deamon" or "dbus" are considered as background processes. Each row consists of tree like structure that can be sorted from any column.
- The top of column (headers) shows the overall system performance metrics.

-
Pid : Unique Process Id for the process
-
Name : Name of the process
-
*rCPU : The overall CPU utilisation of the parent + CPU utilisation of all of its children and children of child being a recursive value, for the leaf process the CPU and rCPU would be same.
Example: Process FireFox
The rCPU for the FireFox will be the sum of all the CPU utilisations of all its children (web contents) and their rCPU and CPU column are same as they don't have children.
FireFox_rCPU = FireFox_CPU + All_child_CPU : 1.4 + 0.6 + 0.1 + 0.1 + 0.4 + 0.1 + 0.6 +0.1 = 3.4

-
CPU : CPU utilisation for that process
-
*rMemory : Recursive Memory utilisation calculated similarily as rCPU. This gives a better idea as to how much a process is using the memory.
In the above example the "FireFox" uses 547.4 MiB as only one process while as a whole with child it uses 3039 MiB which is the real truth.
-
Memory : The Memory Utilisation of the process which solely belongs to the process. Calculated as Resident_Memory - Shared_Memory = Memory util of the process.
-
DiskRead : The disk read speed at which the process is doing IO operations.
-
DiskWrite : The disk write speed at which the process is doing IO operations.
-
*rDiskRead: Recursive Disk Read calculated similar to rMemory and rCPU.
-
*rDiskWrite: Recursive Disk Write similar to rDiskRead.
-
Resident Memory: It is the actual memory that is in the physical memory associated to the given process (not only this process also includes the shared memory with other processes).
-
Shared : Shared memory with other processes.
-
Owner : User to whom the process belongs.
-
Command : The command corresponding to the process.
- It is a process kill button. Pressing it would cause the process to get terminated after asking for a confirmation.


- Shows the graphs for the major computer devices.
- Contains graph for : CPU, Memory, Disks, Network Adapters, Nvidia GPU
- CPU utilisation in %
- Number of running processes
- Temperature
- Current CPU usage speed
- Number of CPU Threads
- Number of cores
- Logical processor count
- Max CPU speed
- Virtualization
- L1/L2/L3 cache sizes
- Total installed Memory size
- Current Memory usage
- Available Memory
- Buffer / Cache size
- Swap size
- RAM speed
- Memory slot used
- Form Factor
- Total disk size
- Disk Active state in %
- Read / Write speed
- Partition details
- Mount points
- Filesystem type
- Total and Available free space
- Name of the Network card
- Send and Receive speed
- Total sent and received bandwidth
- IPv4 / IPv6 addresses
- Mac address