PSGraph is a PowerShell module that allows you to script the generation of graphs using the GraphViz engine. It makes it easy to produce data driven visualizations.
Register-PackageSource -Name Chocolatey -ProviderName Chocolatey -Location http://chocolatey.org/api/v2/
Find-Package graphviz | Install-Package -ForceBootstrap
Find-Module PSGraph | Install-Module
Import-Module PSGraph
Using a custom DSL, describe how nodes are connected with edges
Graph "myGraph" {
    Edge start -To middle
    Edge middle -To end
}
Then we can render the graph as an image.
Graph "myGraph" {
    Edge -From start -To middle
    Edge -From middle -To end
}  | Export-PSGraph -ShowGraph
The real fun starts when they are data driven
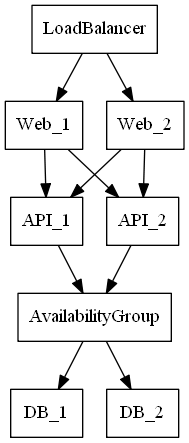
Imagine you wanted to diagram a server farm.
I'm generating example servers here:
# Server counts
$WebServerCount = 2
$APIServerCount = 2
$DatabaseServerCount = 2

# Server lists
$WebServer = 1..$WebServerCount | % {"Web_$_"}
$APIServer = 1..$APIServerCount | % {"API_$_"}
$DatabaseServer = 1..$DatabaseServerCount | % {"DB_$_"}
But you could source these from AD or your CMDB
Then describe how those lists of servers are related
graph servers {
    node -Default @{shape='box'}
    edge LoadBalancer -To $WebServer
    edge $WebServer -To $APIServer
    edge $APIServer -To AvailabilityGroup
    edge AvailabilityGroup -To $DatabaseServer
} | Export-PSGraph -ShowGraph
For more information


