-
Notifications
You must be signed in to change notification settings - Fork 9.4k
New issue
Have a question about this project? Sign up for a free GitHub account to open an issue and contact its maintainers and the community.
By clicking “Sign up for GitHub”, you agree to our terms of service and privacy statement. We’ll occasionally send you account related emails.
Already on GitHub? Sign in to your account
☔ Pagespeed Insights results differ from lighthouse in chrome #6708
Comments
|
Hey, thanks for reaching out! To help with diagnosing this we'll need to have the URL you're testing, and the context that you are running Lighthouse in. How did you get the 92? Are you running on Devtools in Chrome? On the node CLI? And what throttling settings are you using? |
|
Hey @exterkamp, i've made an audit with lighthouse in DevTools in Chrome and now tested it with node CLI aswell. These are my settings: |
|
@exterkamp Thanks for testing it. It's odd that there's no Performance score when using the CLI version (although Best Practices gets a score as you can see). And it's very odd that the TTI differs so much. |
|
@exterkamp So, i made some changes to pass some more of the audits for mobile. Lighthouse in DevTools Pagespeed Insights Both tests were made on newly updated production site. |
|
Currently on Chromium Version 71.0.3578.80 I get the same weird results for almost any website. Lighthouse in DevTools is always 25-45 points better than on PSI. Could this be related to DNS lookups or similar stuff? Could PSI server have a little bit slower access to the tested website than my local machine (depending on where the server actually located in US or in EU? |
|
@AlexVadkovskiy just checked the website (https://www.omgubuntu.co.uk/) from Germany. PSI: 29 (mobile scores) |
|
Hmmm checking out https://www.omgubuntu.co.uk/ I get: So this is solidly reproducible for that site. I am force running pagespeed in the EU and seeing similar results. I will say that pagespeed has a consistent ~200ms TTFB while running locally have ~60ms TTFB, and that URL seems to send more images to pagespeed for some reason? Some odd behavior for sure, and some questionable latency which might be us or the site. @patrickhulce might want to take a look at this from a lantern perspective on why this could be different/maybe something is up with the trace. @paulirish might want to take a look at this from a global pagespeed latency perspective. |
|
@exterkamp is this the same case as @wardpeet brought up? some of his runs in LR had every request duplicated which would immediately explain 2x lantern predictions. @AlexVadkovskiy the Chromium difference is also probably explained by #6772 FYI |
|
@patrickhulce I remember that, but I can't find that issue/discussion, you have a link to it/can you bump it to mention this thread? |
IIRC that's because we just discussed it over chat :) @wardpeet do you happen to still have those? |
|
@exterkamp any update here? |
|
@patrickhulce so there is a bug in chrome which is mentioned in other issues. Will this fix the PSI score as well ? |
|
@vertic4l to which bug are you referring? |
|
Oops this got buried! Missed that bump. I will definitely be looking into these URLs again soon. So far we have:
Taking a guess, the bug might be ignoring flags? But that shouldn't be an issue because this was reported before that version of Chrome shipped iirc. |
|
I'm having the complete opposite experience with this. My dev tools Lighthouse is give me a score of 37 where PSI is giving a score of 91. The url in question is: https://biketours.com |
|
@ashtonlance I'm seeing PSI score of 24 for that URL |
|
@patrickhulce Sorry, those number I gave were the desktop scores. |
|
@ashtonlance Ah you're probably experiencing #6772 then. Give it a whirl in Chrome Canary. |
|
@exterkamp I'm seeing the same issue, where Lighthouse reports a high score while PSI shows a lower one. You can try on this url |
|
@ashtonlance something is off, that's Lighthouse |
|
@patrickhulce Weird indeed. That was from a build I downloaded at https://www.google.com/chrome/canary/. However, I just downloaded a fresh copy and all seems to be good now. |
|
@exterkamp any news? |
|
PSI is not run with a real browser (only trying to simulate browsers to cut infrastructure costs) so that's why the results differ from Lighthouse in chrome (observed mode). |
|
And it is almost impossible to run PSI locally, see https://twitter.com/patrickhulce/status/1331961018654855168?s=20 So just don't use PSI, use gtmetrix.com for one user and one page or supervisor.com for multiple pages and multiple users |
Google has made clear they don't use lab data for ranking but field data, so basically the scores are nothing as it used to be. But in order to optimize and fix problems, lab data is the only thing we can immediately see the changes (field data requires 28 days), so we still have to use it as one of the tools to measure performance along with webpagetest and others. |
|
Sorry, I missed this thread... have the same issue: #11908 |
I have same feelings. I'm spending my weekend tasked with improving this laughable metrics. With every click on 'analyze' on page insights I'm getting scores diffing by about 20 points, listing different 'reasons' each time. How am I supposed to use it? I went to check how their page https://developers.google.com/web/tools/lighthouse/ that is supposed to tell us how we should prepare our pages to please this vague tool does not do well for mobile score - barely 40 points and it is as well -+10 points after each 'analyze'. Looks like even google can't figure out how to please this tool. Lots of negatives here, but I'm just trying to finish my work and spend some time with family instead of trying to guess what google/lighthouse wants from me. |
|
I have run PSI and Lighthouse in Chrome DevTools for mobile. Found the FCP and LCP in both cases are varying. Also, i can find the different results when checked from different locations. Once try on this url https://mydepartments.in/. |
|
@VenkatSandeeph yeah, you site loads way faster than what those screenshots show |
|
I am trying to optimize my site and getting the same issue with this link- https://cardinsider.com/best-credit-cards-in-india/ |
|
I'm getting drastically different numbers for http://tamagui.dev Locally mobile gets 95 performance, pagespeed.web.dev gives 46, consistently for each. Both show Moto with slow 4G. The only difference I see is pagespeed runs headless. The big difference is Total Blocking Time, which to me indicates that React Concurrent Suspense hydration isn't running properly. I can turn of Suspense locally and I get numbers much closer to pagespeed. But it's just a guess. |
|
@natew I'm getting around ~PSI's score when I run locally. Do you happen to have Clear Storage enabled? To debug further, it'd great if you could do the same Lighthouse run with the CLI and |
|
We simulate the timings. https://github.com/GoogleChrome/lighthouse/blob/master/docs/throttling.md So unless you're running with non-default settings to apply no network emulation, you can't compare the results with how long it took in real time. Although... being on a hotspot may impact the input/quality of the simulation. Not certain, but I would be weary of that being an accurate test. |
|
Got a 20 again at home. This is what I get in browser: Edit: that is running incognito and not, cleared data. Tested the same on Brave. |
|
same problem here, when using Chrome dev Tools I got better results than Pagespeed insights. So i don't know how test a local website with consistent values. |
|
@eliawk please make sure you apply "DevTools Throttling (advanced)" when testing Lighthouse in Chrome DevTools, that should help to match a similar emulation with the PSI one. |
|
@gilbertococchi thanks for your answer, but I was already using "DevTools Throttling (advanced)". Even with that setting I get 95 on Chrome and 67 on Pagespeed as you can see from the screenshots: |
|
I suspect TBT times are different, perhaps because of CPU condition, Extensions blocking 3Ps or other stuff. More info here: https://developers.google.com/web/tools/lighthouse/variability |
I agree, you have to adjust throttling and CPU conditions and perform it in an incognito window. Both DevTools Lighthouse and PSI are lab testings and both rely to different conditions. The local Lighthouse relies in your specific PC settings simulation and the PSI relies on it own simulation. Don't expect to have exact same values in both testings anyway. |
|
really extreme difference to same location Mobile both going to https://dev.d33869rf57mkjo.amplifyapp.com/ chrome version: 118.0.5993.70 

|
I recommend verifying your server's performance from the USA, specifically from Mountain View, California. This is crucial because PageSpeed Insights (PSI) conducts its requests from that location. By doing so, you can get a more accurate representation of how your site performs in PSI tests. |
|
HI @adamraine/ @connorjclark/@exterkamp, I'm inquiring about the progress on this issue. It has been open since 2018, and there hasn't been any update regarding ongoing work or an ETA of completion. Many people/companies rely on PSI and Lighthouse, so could you please share an update? |
|
There is no way to properly solve this: PSI machines are running some cpu architecture in some data center in somewhere - unless Lighthouse is running in the same machine, same network and same time, the results will vary. Also, it makes no sense to just test for one page - for example my startup, https://www.supervisor.com provides 24/7 automatic web vital monitoring with real browsers that are running with dedicated resources to provide consistency in the results. Once a browser clicks automatically the entire site and checks the metrics, it's natural to extend this as a load test also by just adding more of the same browsers (something that we also do) |


Hey there!
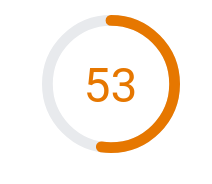
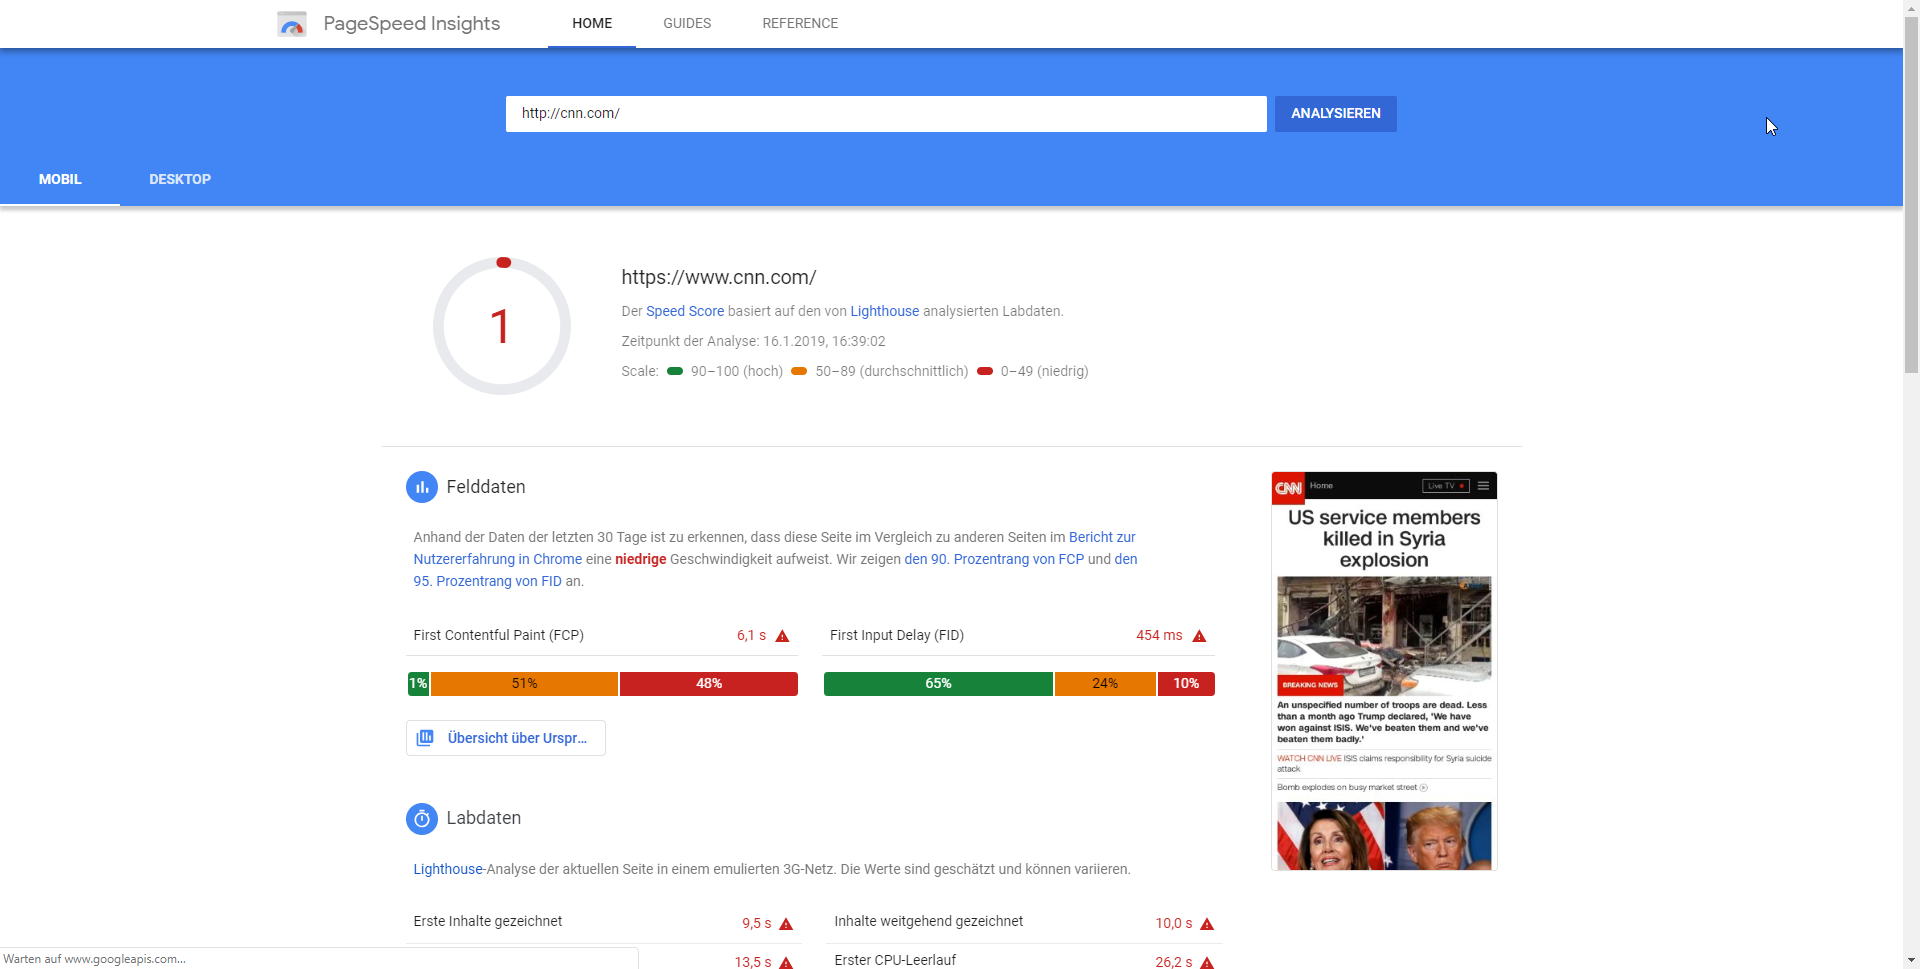
I'm optimizing a mobile site and lighthouse reported me a score of 92. So far so good i thought. But after checking back with Pagespeed Insights, which also uses lighthouse, i'm getting a score of 57.
Is there any reliable way to get the same score?
The text was updated successfully, but these errors were encountered: