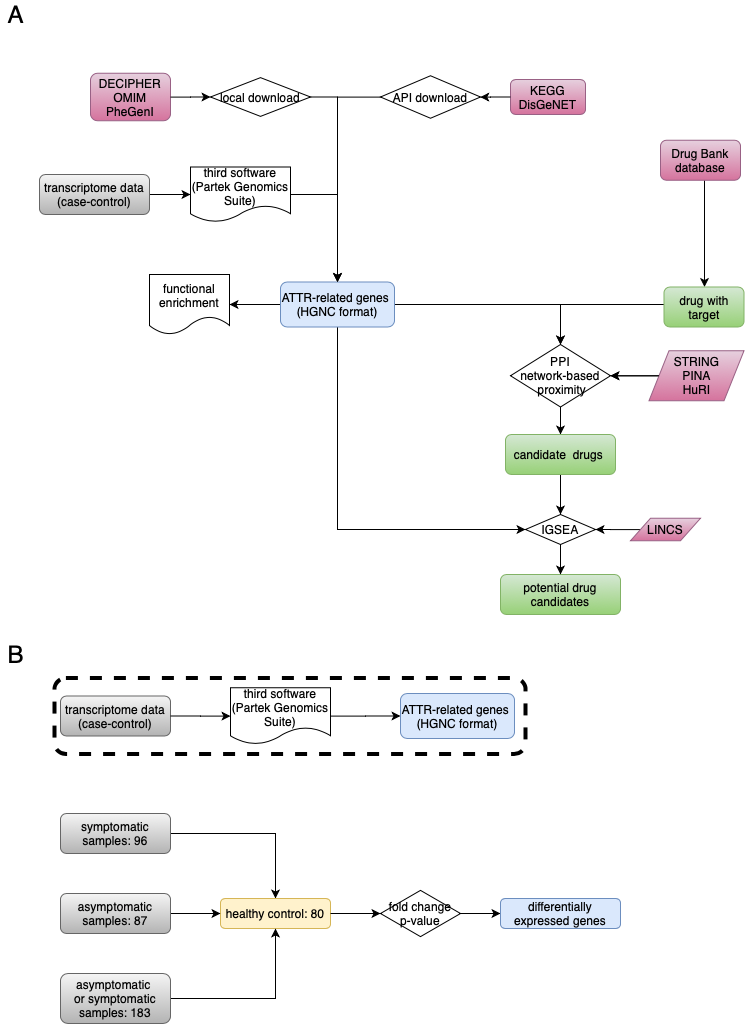
This repo contains all source codes and files for TTR disease analysis
Download gene-disease association(GDA) from public database using API or from the website directly.
DisGeNET database contains multiple public database, and we use API (UMLS CUI:C2751492,disease_name:'AMYLOIDOSIS, HEREDITARY, TRANSTHYRETIN-RELATED') to download GDAs. 74 genes are extracted from this database. At finally, we got 74 genes (HGNC format) from DisGeNET.
| TTR | RBP4 | CYP2A7 | GPC5 | LCT | NOTCH1 | BGN | MIA |
|---|---|---|---|---|---|---|---|
| APC | MFT2 | AGER | PART1 | C4orf3 | NTF3 | TNMD | AXIN2 |
| MUTYH | MIA-RAB4B | DPYD | GCG | MLH1 | SERPINA1 | DCLRE1B | CASP3 |
| GSN | MTCO2P12 | EIF2S1 | GLB1 | MMP9 | PLA2G2A | SNCA | EIF2S2 |
| PTGS2 | NLRP3 | EIF2S3 | GPSM2 | MRC1 | PPP1R1A | TRIM21 | |
| CTNNB1 | CLU | EPO | IAPP | MSH2 | PYY | SST | |
| APOA1 | COL11A1 | ALB | IL6 | COX2 | RDH5 | VEGFA | |
| APOE | CRP | FAP | IL10 | NUDT1 | RLBP1 | VIP | |
| NPPB | CTSE | ALDH1A3 | KRAS | NEFL | ATXN1 | CACNA1A | |
| B2M | CYLDCYP2A7 | FBN1 | LCN2 | NGF | ATXN2 | CAL |
This database aren`t free, only available for website research. TTR gene was extracted.
KEGG have multiple subdatabases. We use pathway (no result) and disease (family amyloidosis) database for GDAs research. 5 genes (HGNC format) were extracted from KEGG disease database.
| Gene symbols | Gene symbols | Gene symbols | Gene symbols | Gene symbols |
|---|---|---|---|---|
| TTR | FGA | APOA1 | LYZ | B2M |
No API available for this database.There are no feedback for transthtretin amyloidsis.
You should input the phenotype (mainly from mayo clinic and ICD-10) of disease. 14 genes (HGNC format) were extracted from PheGenI trait.
| NTN5 | SEC1P | BAG3 | MAML3 | FUT2 | CCND1 | RNA5SP56 |
|---|---|---|---|---|---|---|
| PSMC1P12 | ZBTB17 | DNAH11 | SMARCD3 | SLC44A5 | PAFAH1B1 | CBX7 |
This database integrated the expert curated database. However, the information maybe cann`t be updata timely. So the gene number from Enricher DisGeNET and KEGG is lower than that from origin databases.
At finally, we get 498 non redundant genes (HGNC format).
We downloaded the raw CEL files from this URL: https://www.ncbi.nlm.nih.gov/geo/query/acc.cgi?acc=GSE67784
56 differential expression genes were obtained using Partek genomics Suite software from three groups as shown in Fig 1b.
According to PPI network, we can calculate the shortest path of disease-related gene list and drugs with target. Give S, the set of ATTR-related genes; D, the degree of ATTR-related genes in the PPI; T, the set of drug target genes and distance d(s,t), the shortest path length between nodes s (ATTR-related gene in our case; s belongs to S) and t (drug target in our case; t belongs to T) in the network, as below: $$ d(S,T)=1/|T|\sum t\in T min s\in S (d(s,t)+w) $$
where w, the weight of a target gene, was defined as the target was w = -ln(D+1), one of the AD-related genes; else, w = 0.
To assess the significance of association between a drug and AD, we generated a simulated reference distance distribution corresponding to the drug. Briefly, a group of proteins (denoted as R) matching the size of drug targets were randomly selected in the network, then the distance d(S,R) (defined by Equation 1) between these simulated drug targets (representing a simulated drug) and AD-related genes was calculated. The reference distribution was generated by repeating the procedure for 10,000 times. The mean d(S,R) and standard deviation d(S,R) of the reference distribution were utilized to convert the observed distance corresponding to the real drug into a normalized distance, i.e., proximity value: $$ z(S,T)=(d(S,T)-\mu )/ \sigma $$ This function can be implemented using python script .py.
python PPI_distance.py -targetgene target_gene_list.txt -drug drug_target.txt -ppi PPI_edges_noredundant.txt -length_ppi 504815 -out real_drug_resultDue to lack of parallel python package of CPU, the 10000 simulation were exected by submitting this script repeatly.
Drug-induced gene expression profiles were extracted from the Library of Integrated Network-based Cellular Signatures (LINCS; https://commonfund.nih.gov/LINCS/) L1000 dataset, which included several assays, cell types and hundreds of small molecule drugs with different dosages and culture times (Subramanian, et al., 2017). Only the expression data of NPC and SKL cell line in level 3(Normalized) was downloaded considering the polyneuropathy and cardiopathy related symptoms in ATTR patients. In cluster server, using GSEA to calculate the ES score and FDR (cutoff 0.25).
bash /data01/xylv/iGSEA/GSEA_4.1.0/gsea-cli.sh GSEA -res /data01/xylv/iGSEA/LINCS/LDS_1292/Data/HUVEC_sm_list/A549_1.gct -cls /data01/xylv/iGSEA/LINCS/LDS_1292/Data/HUVEC_sm_list/A549_1.cls -gmx /data01/xylv/iGSEA/PAH_gene.gmx -chip /data01/xylv/iGSEA/gene.chip -collapse true -out /data01/xylv/iGSEA/PAH_result/LDS_1292_HUVEC -rpt_label A549_1 -set_max 1000
