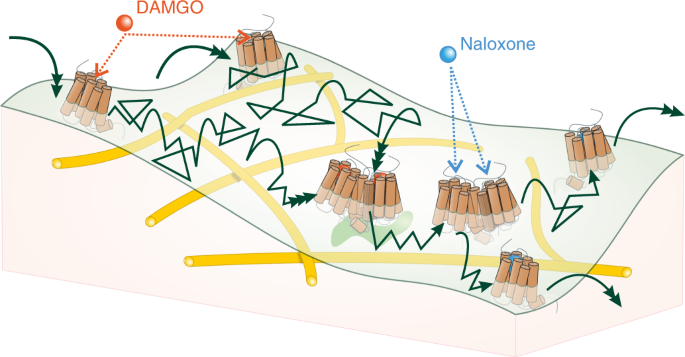
This matlab package contains the necessary code for the analysis performed in the associated publication to analyse the di- and oligo-merization of cell membrane µ-opioid receptors.
This work builds upon existing fluorescence-tracking algorithms from other packages such as u-track, and streamlines the processing of various relevent observables.
Users should open the file "main.m" and edit the variables defined there, as needed, to correspond to their input data. (e.g. time resolution (dt), field-of-view area, etc.), and add some descriptive "Label" to assign to their data in the resulting plots.
A data structure like "TracksFinal" should also be loaded into the workspace (this is often the output from the u-track package). From that point, the main script can simply be run (one might hit "ctrl+Enter" from the matlab IDE), and the package will run; various observables will then be plotted automatically, and output will be stored to the session environment.
One major novelty of the package is the attempt to infer the state of tracks based on their merger/splitting events. As such, many observables are output in lists correponding to their oligomerization state: [1] monomers, [2] dimers, [3] trimers, etc. This "state calling" is susceptible to known biases, as the ability of polytracker to accurately determine the state via events diminishes with higher-order oligomerizations. An indicator for quality-control purposes is plotted automatically comparing the assigned state to average luminescance intensity. Generally, the correlation is positive (as expected), however the slope of this line will be biased downward due to preferential photo-bleaching of higher-states.
That is, "dimer" lumuniscence appears greater than for "monomers", but significantly less than twice. Correction for photo-bleaching remains an ongoing effort, however this bias has no effect on the oligomerization life-time measurements. These oligomerization life-time measurements (with the declared, known biases) can be considered reliable regardless of the above, as described in the publication above.
Diffusion calculations are performed using the theory outlined in Vestergaard et al, Phys. Rev. E. 89, (2014), (n.b. Eq. 14 (page 022726-7)). Scatter plots and histograms are produced to illustrate trends in particle movement, and to check for persistent (non-Brownian) movement. Histograms of diffusion data across all polymer states are produced, along with diffusion values per polymer state.
For further clarification, please open an issue, or contact the author. You are free to use this code for scholarly purposes provided you cite the above paper.
